From microbiome analysis to predictive insight
Eagle Genomics set out to connect fragmented microbiome analyses into defensible insight that scientists could trace, trust and build upon
My role Senior Product Designer, promoted to Head of Product Design across the e[datascientist] platform
Impact
6 scientific apps
Across one connected microbiome platform
No-code analysis
Guided workflows from scientific questions to interpretable results
AI + network science
Thousands of microbes explored through multilayer hypergraphs
Aligned C-suite
Around a shared product vision and execution priorities

The challenge
Eagle Genomics was developing a platform combining data processing, statistical analysis and network science. Its ambition was to help research organisations understand biological relationships, predict effects and support defensible product claims.
I joined to turn an inherited hypothesis-testing prototype into a brand-compliant application. My remit expanded into product direction, scientific workflow design and leadership of product designers and data-science prototypers.
The challenge was to turn advanced scientific capabilities into a coherent product that scientists could use with confidence.
What I uncovered
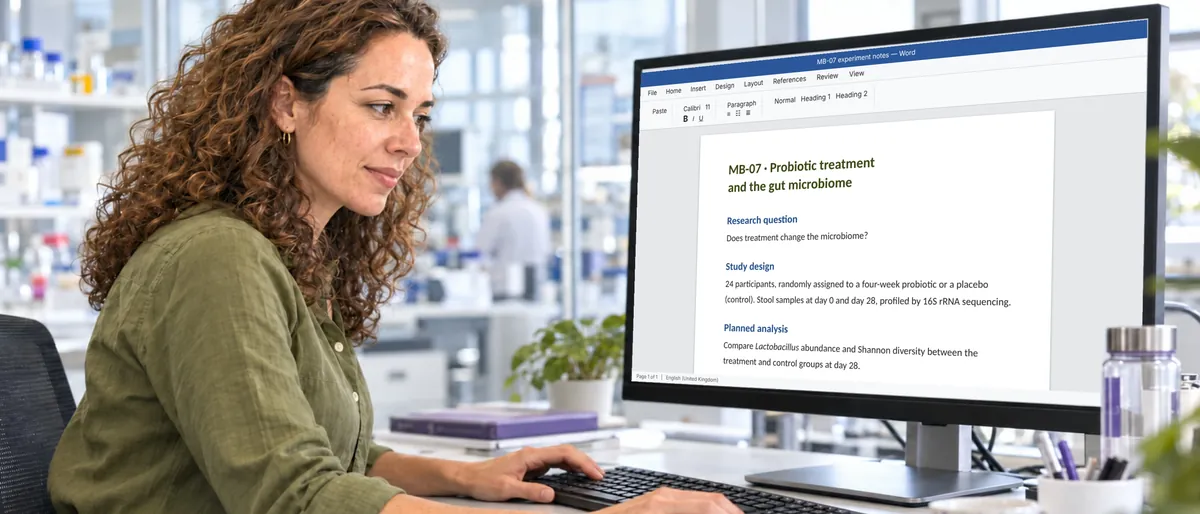
The prototype covered one happy path. The application needed to support different hypothesis types, experimental conditions and analytical choices within a much wider scientific journey.
Working with microbiologists, bioinformaticians and data scientists revealed the judgement behind those choices. Scientists needed to understand whether their data was suitable, which methods were appropriate and what conclusions the results could support. Removing code from the workflow would not, by itself, make the analysis trustworthy.
The longer-term hypergraph ambition also lacked a clear connection between the technology and the purposes it would serve. Discovery revealed three distinct needs: developing products towards a known outcome, finding new uses for known microbes and exploring relationships without a predetermined result. Each required a different starting point and journey.
THE JOURNEY




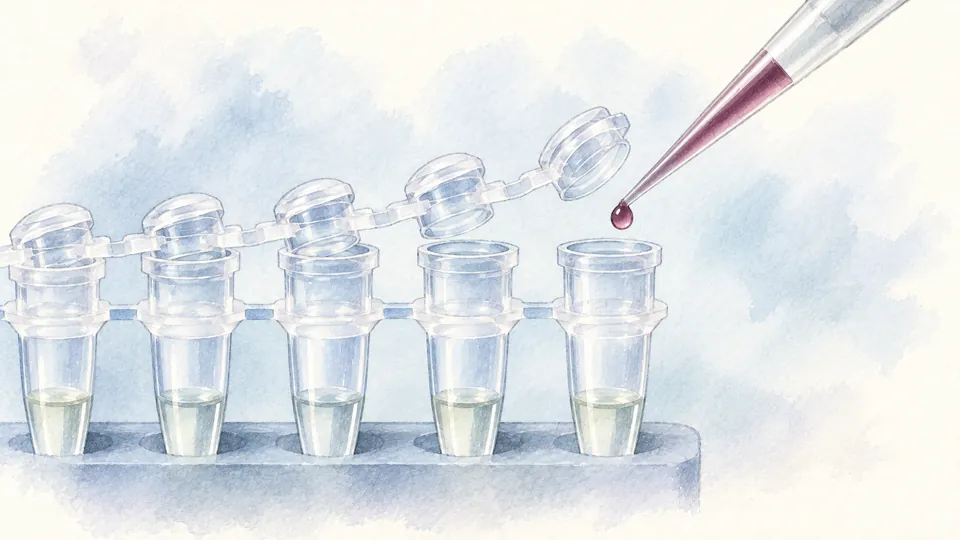
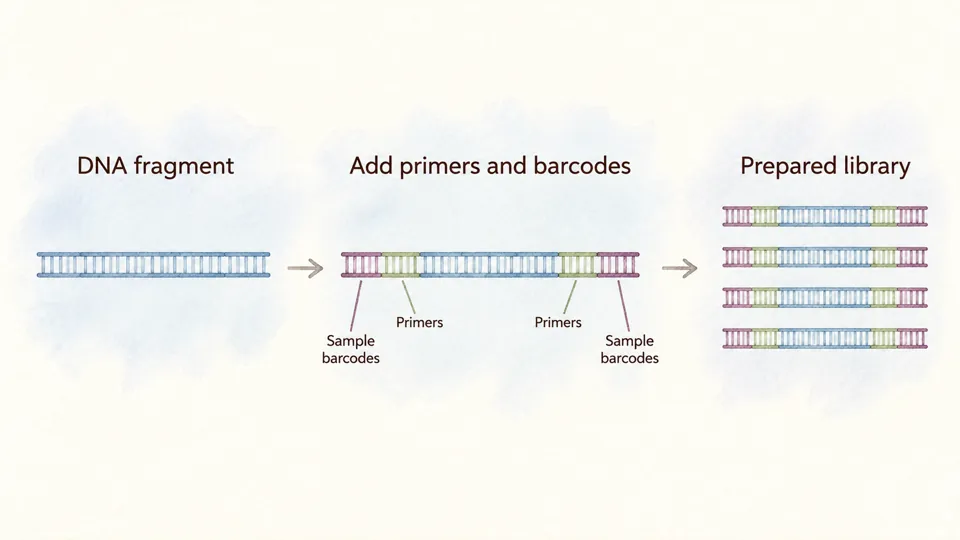
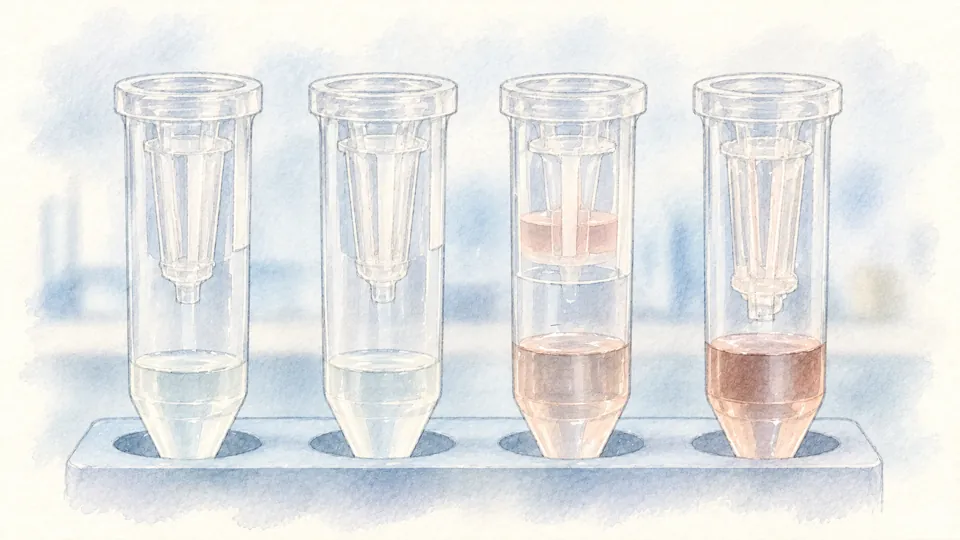

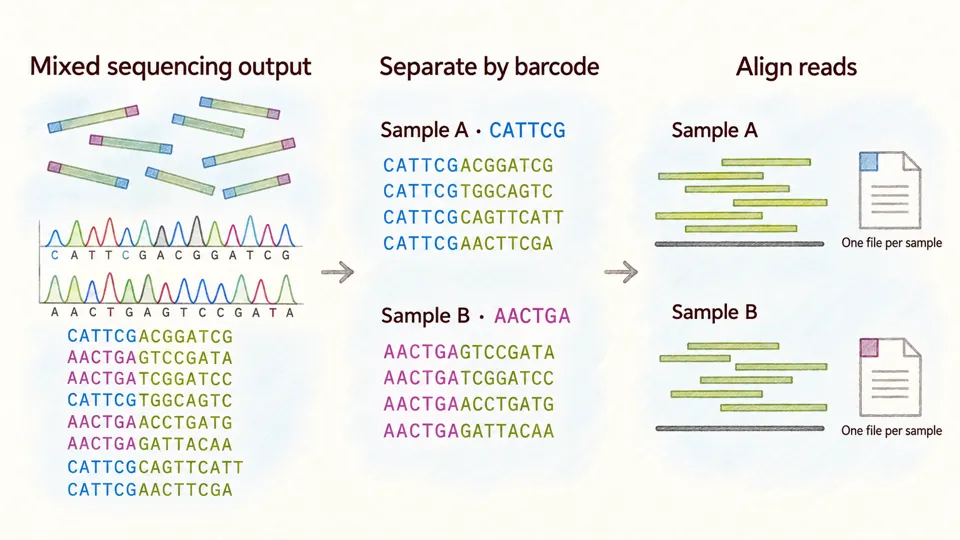
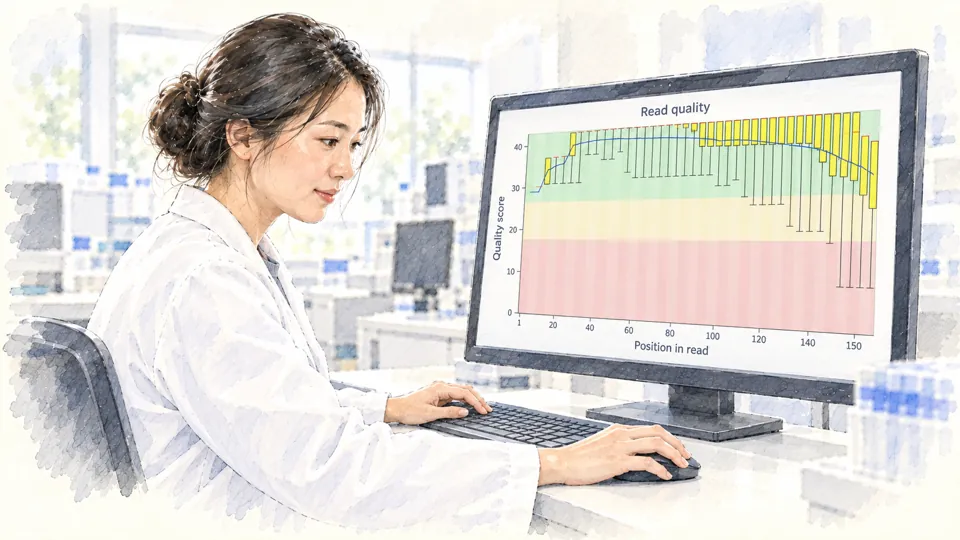

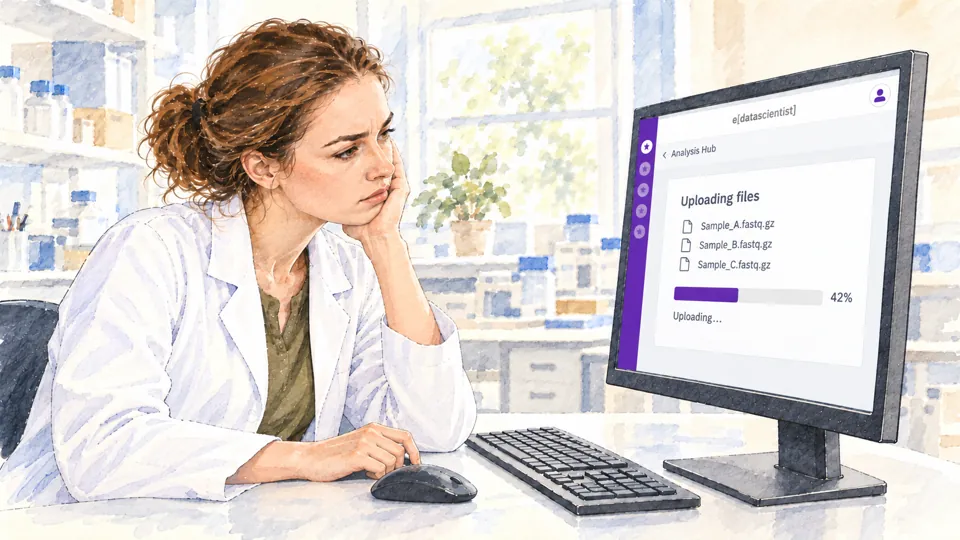
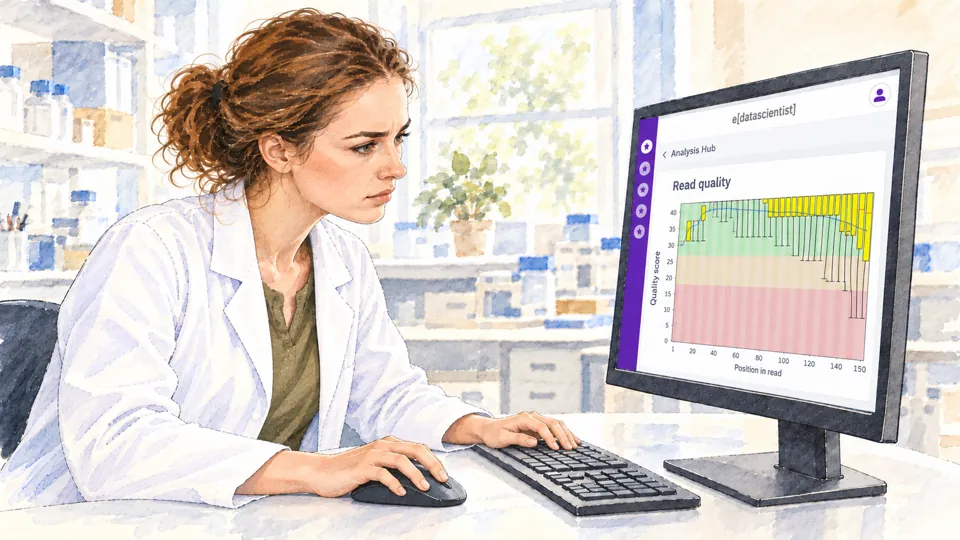

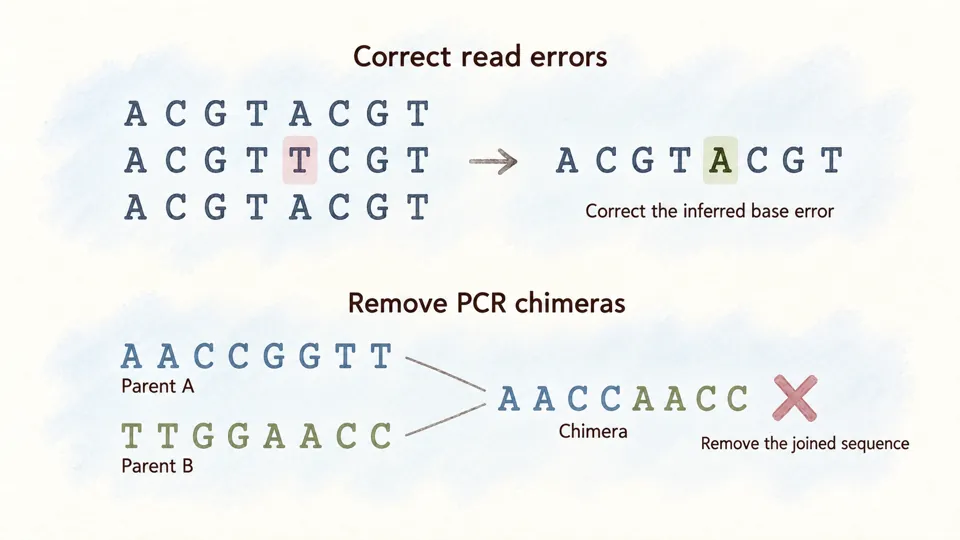
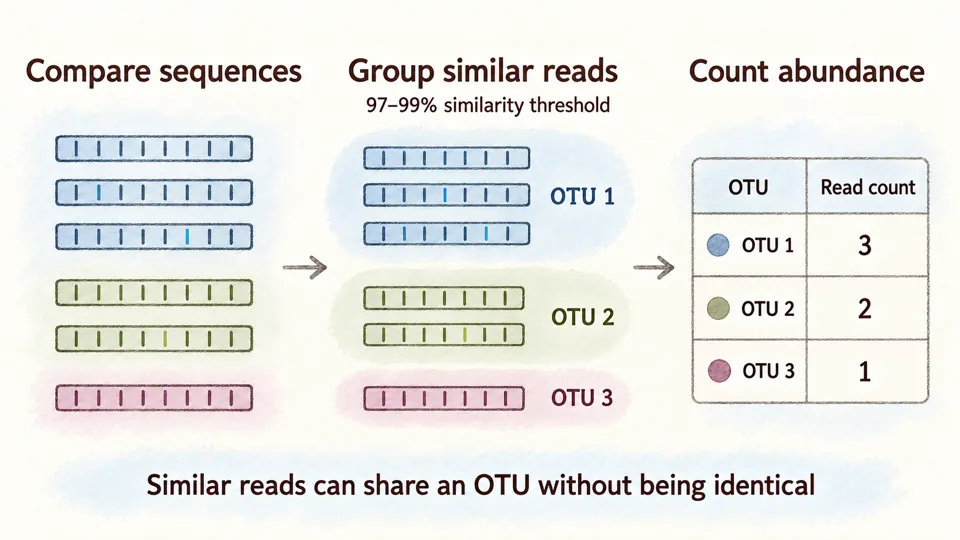



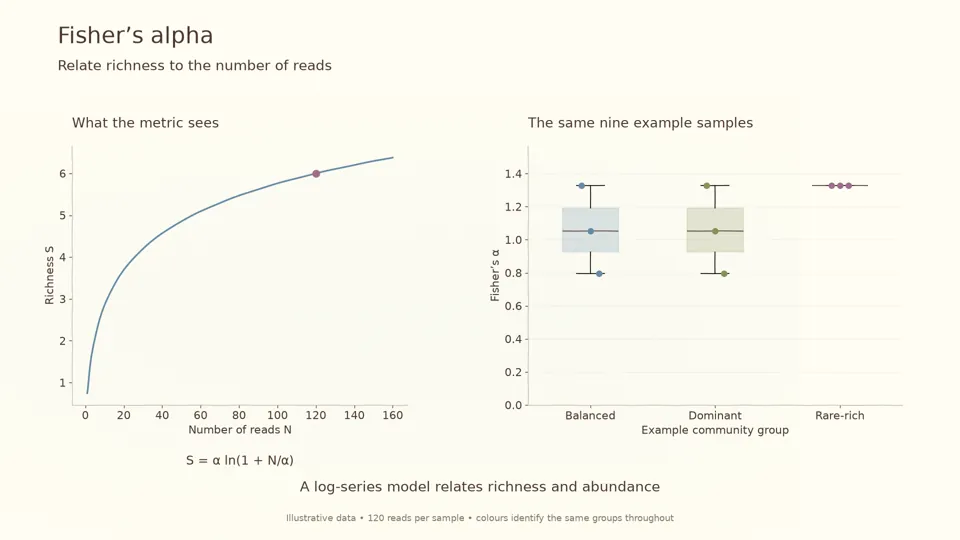
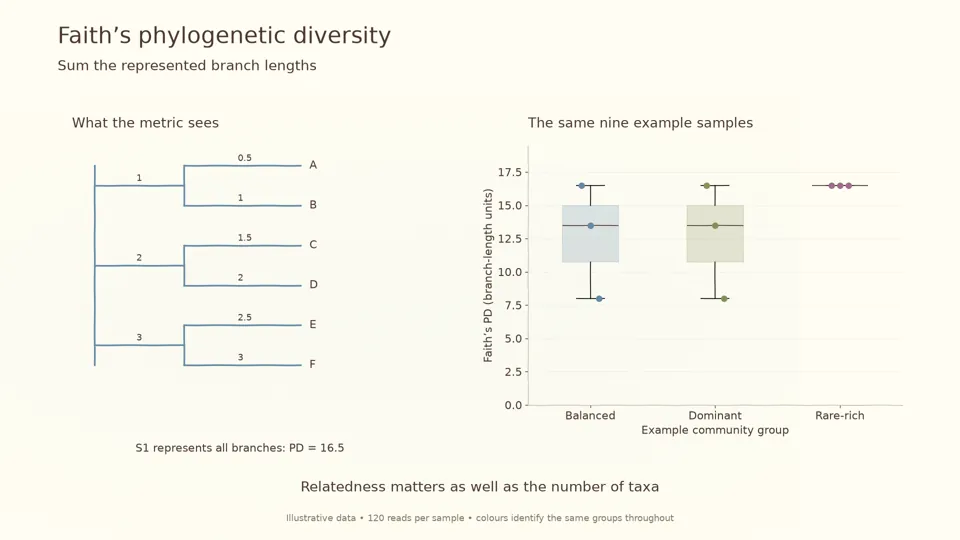
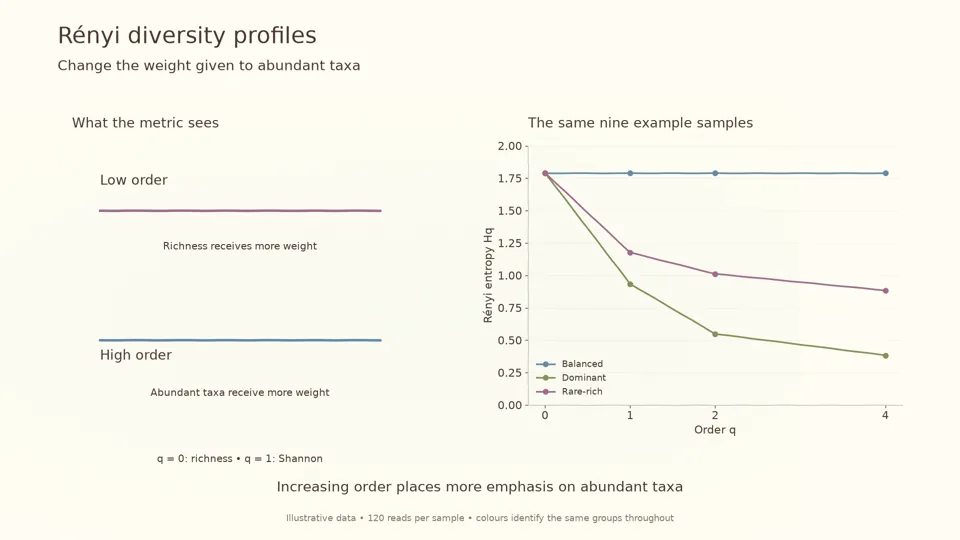
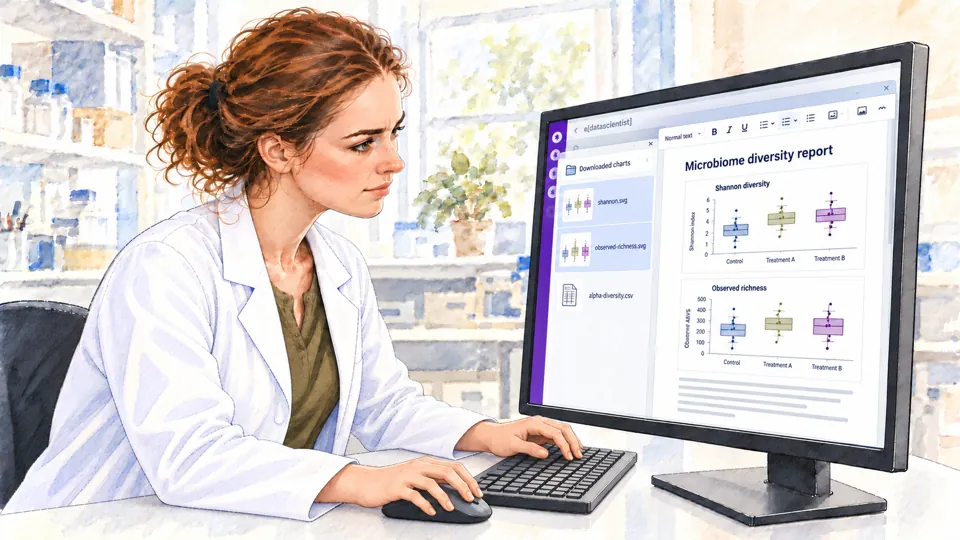
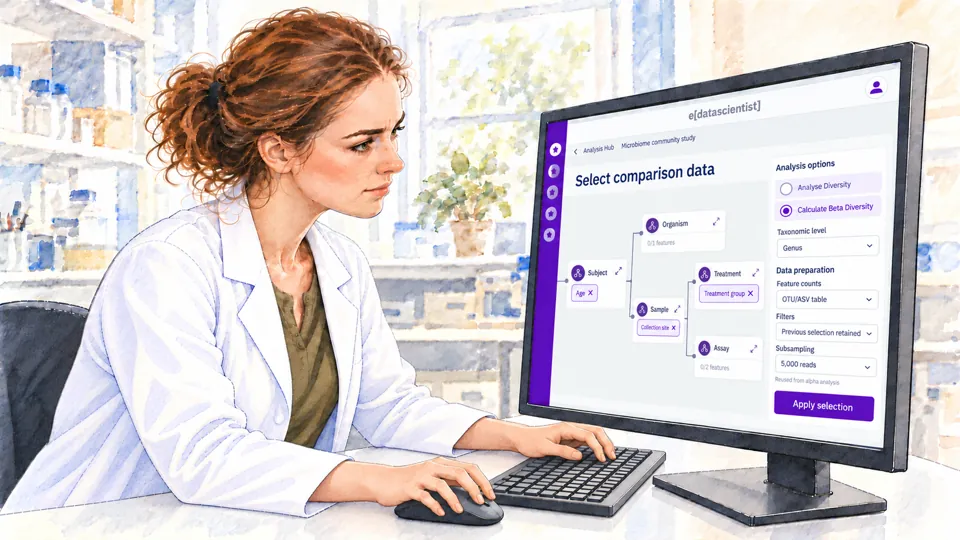
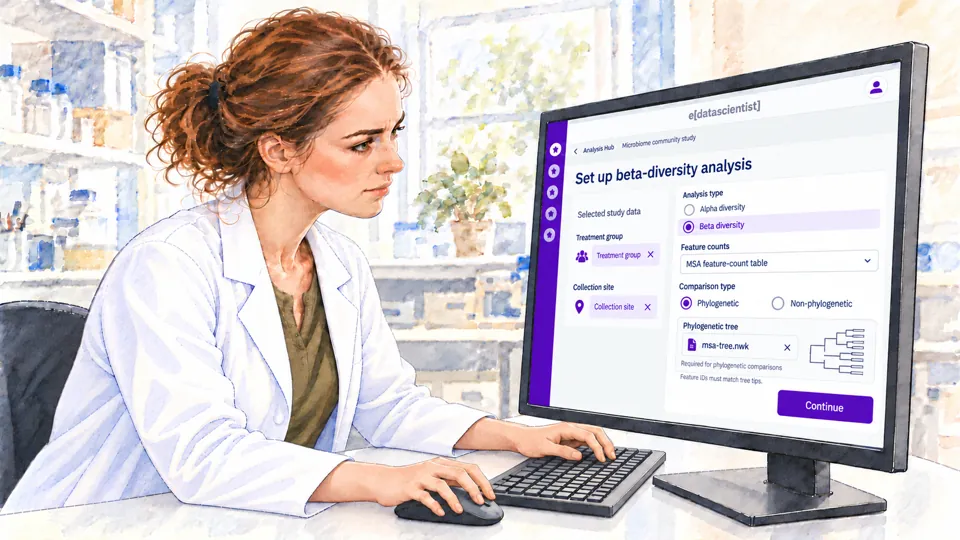
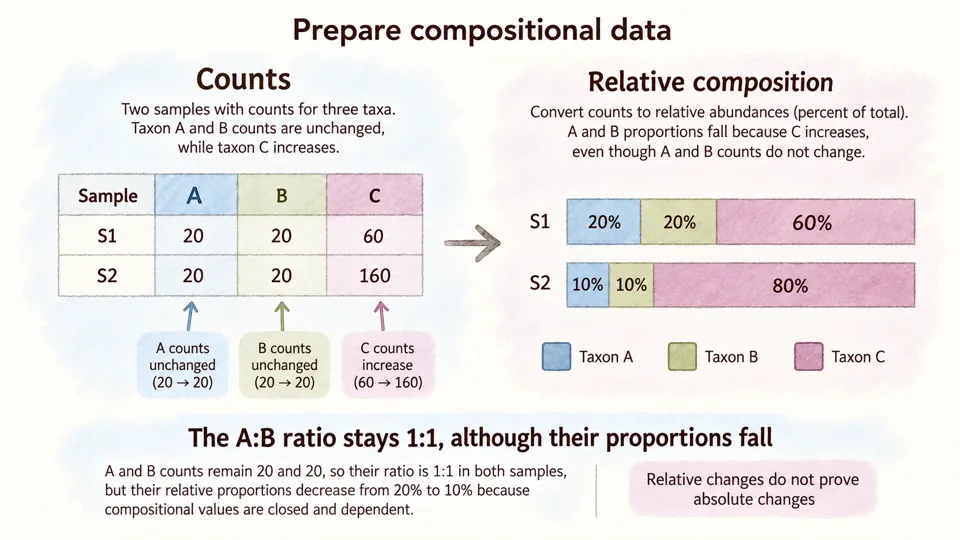
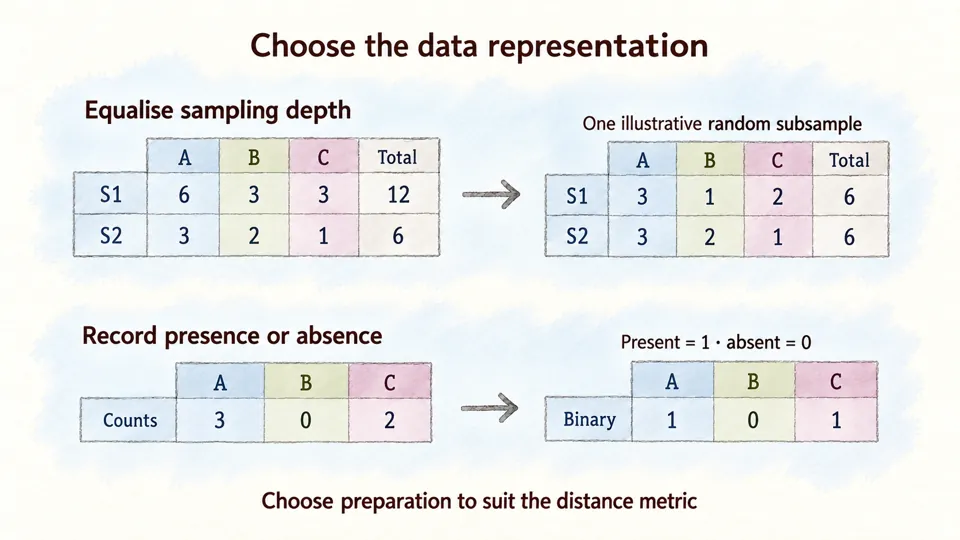
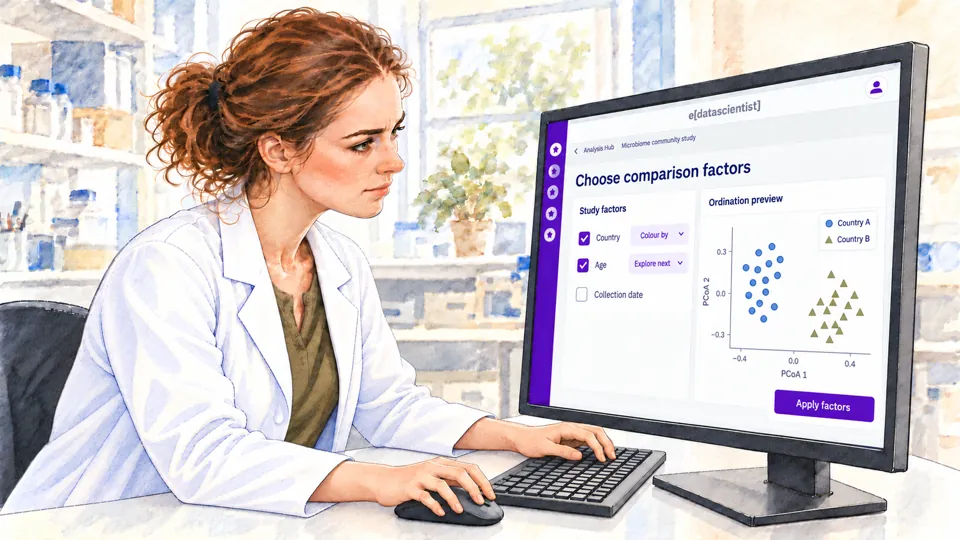
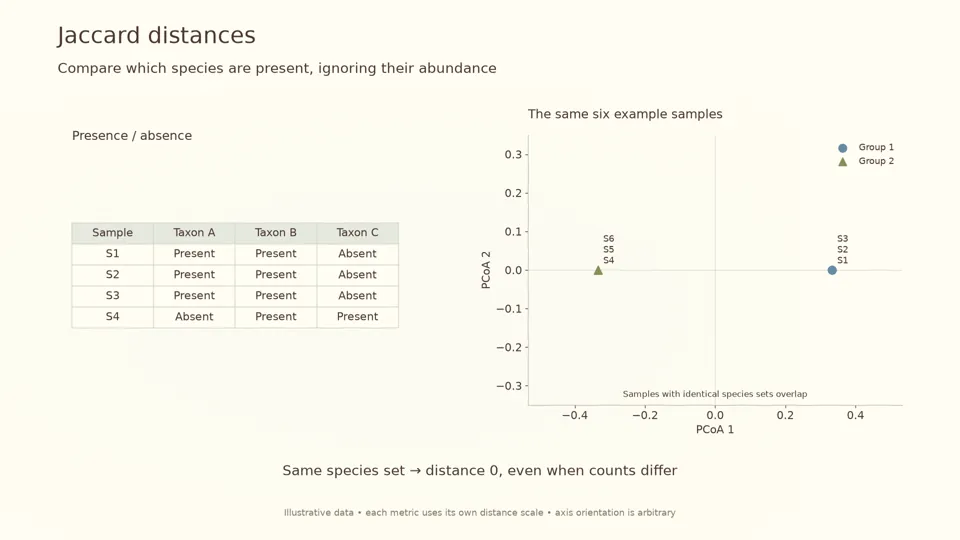
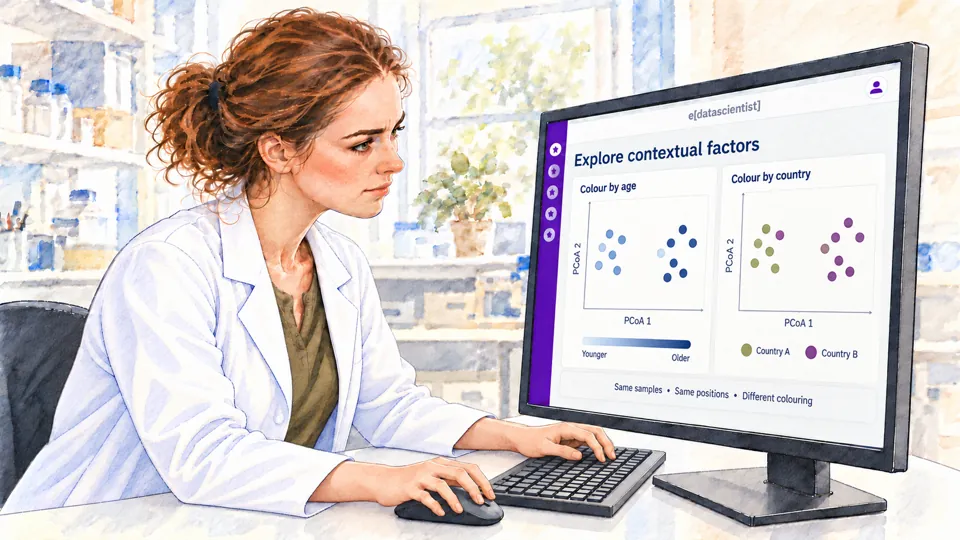
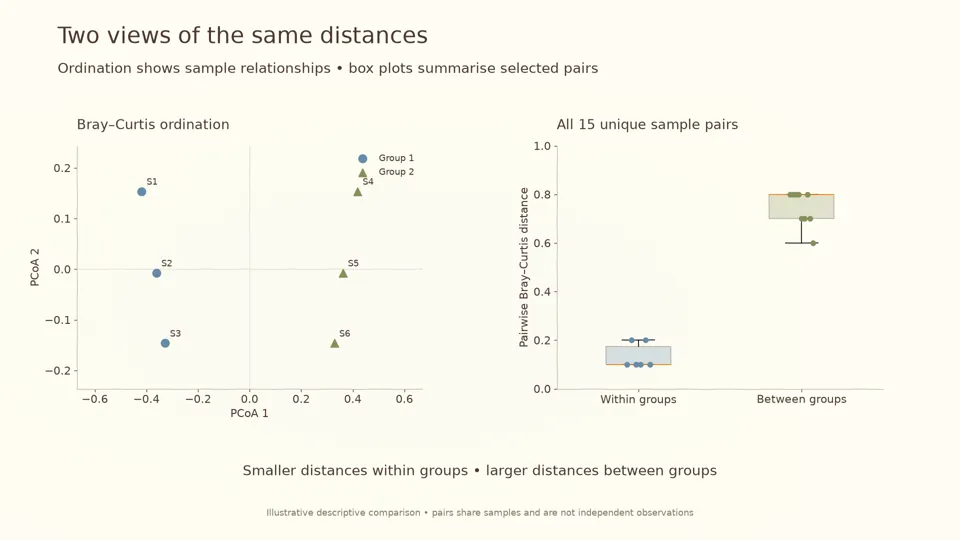
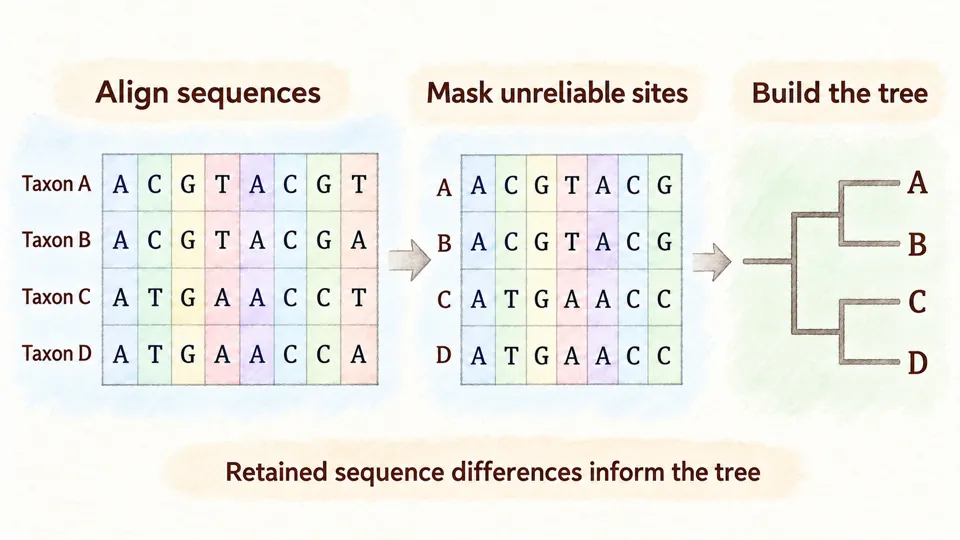
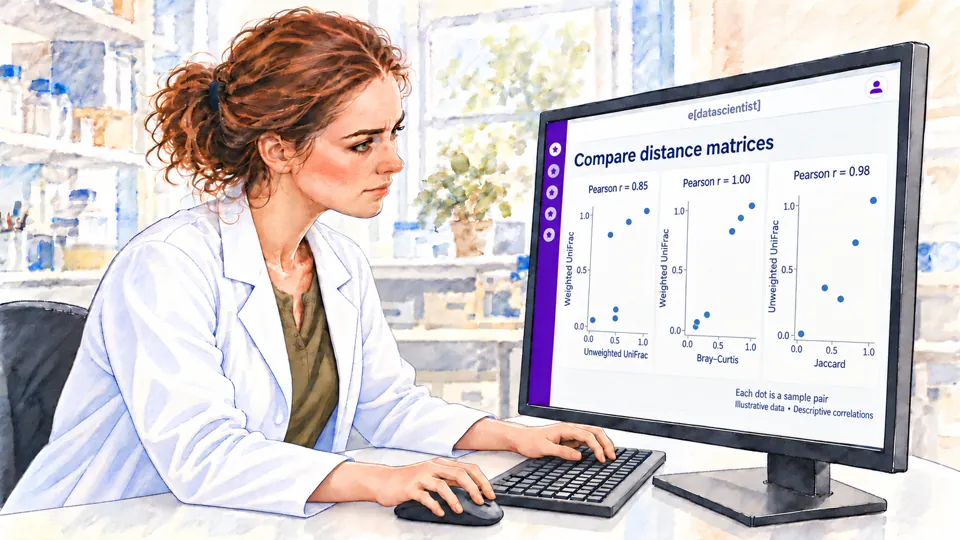
e[datascientist]Example screen
IMAGE PLACEHOLDER
Microbiome Statistical Analysis
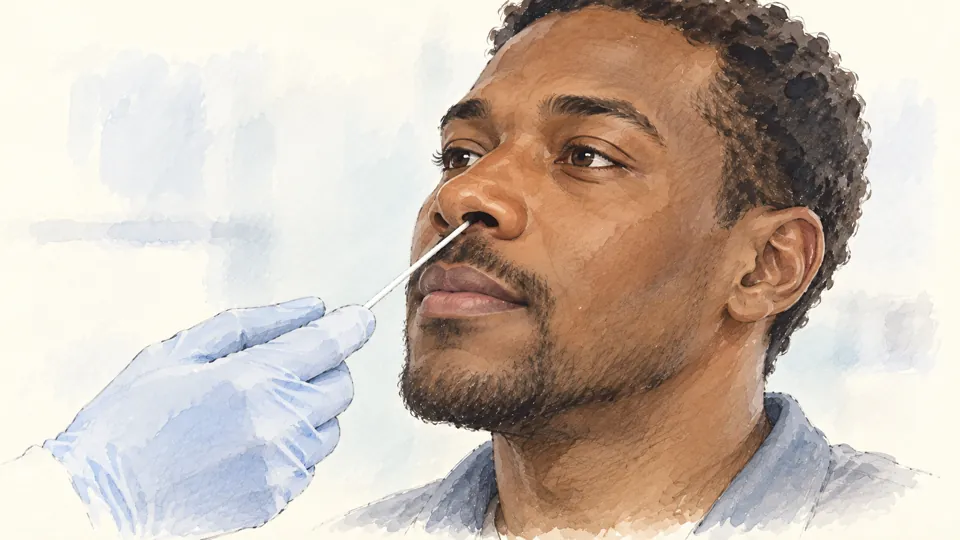
- Prepare and collect samples
- Form a hypothesis
- Review existing research
- Design the study
- Collect samples
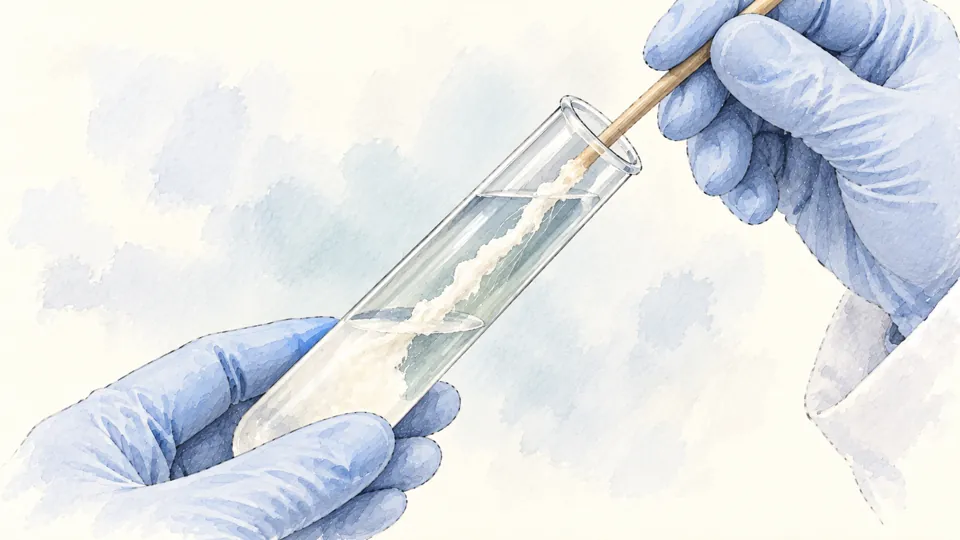
- Transport samples
- Sequence DNA
- Extract DNA
- Amplify marker genes
- Prepare the DNA library
- Purify DNA fragments
- Sequence DNA
- Separate reads by sample
- Check read quality
- Review sample quality
- Clean reads and assign taxa
- Upload study data
- Recheck read quality
- Trim sample reads
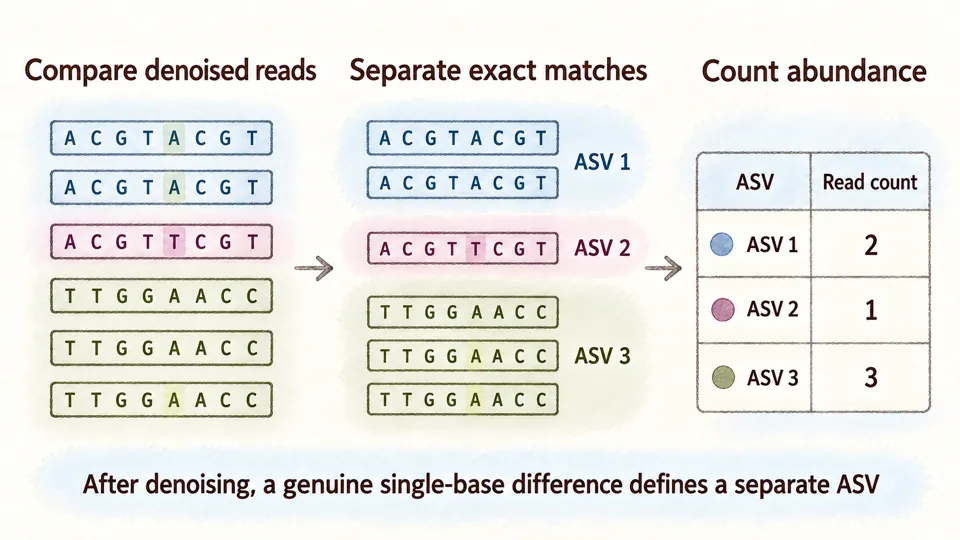
- Denoise sample reads
- Group similar sequences
- Identify sequence variants
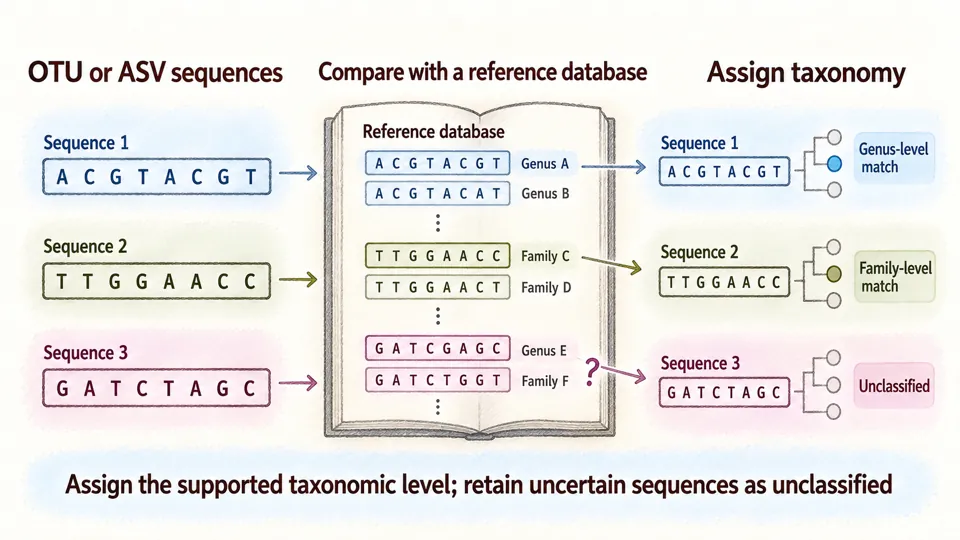
- Assign taxonomy
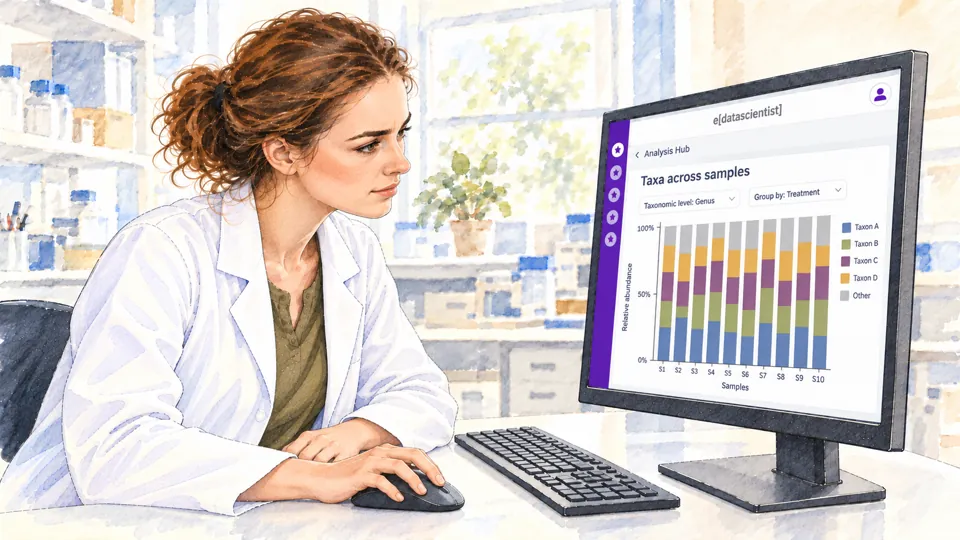
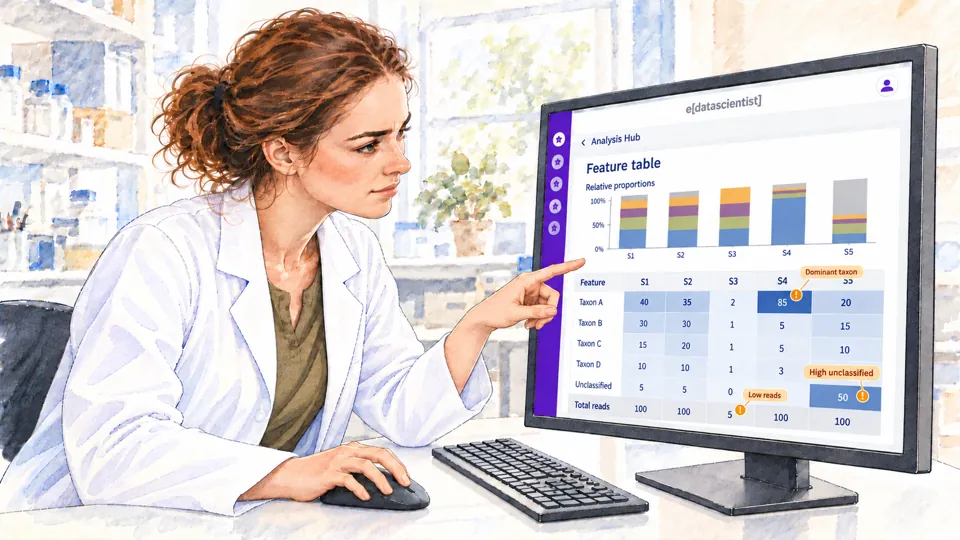
- Explore taxa across samples
- Review feature tables
- Prepare data for analysis
- Upload analysis data
- Select analysis data
- Explore feature-count distributions
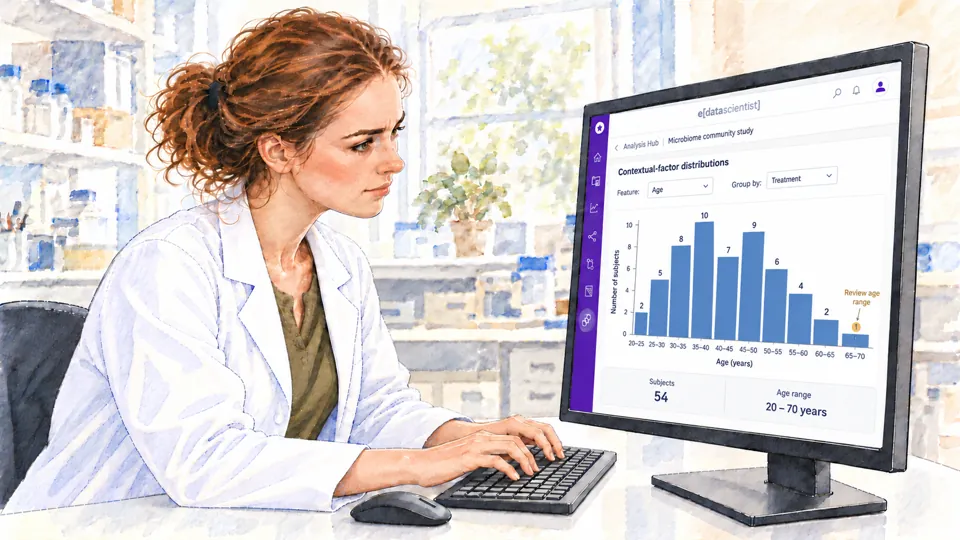
- Explore contextual-factor distributions
- Choose the analysis type
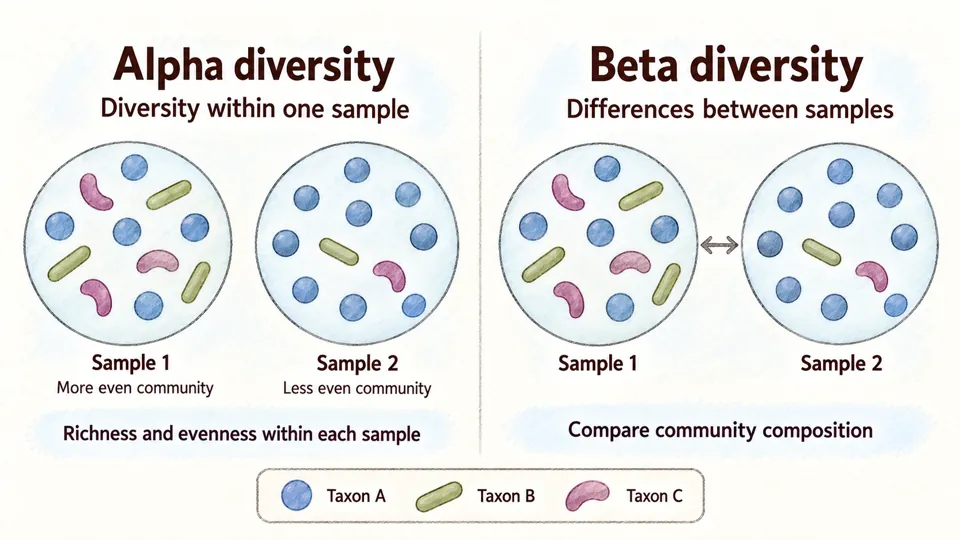
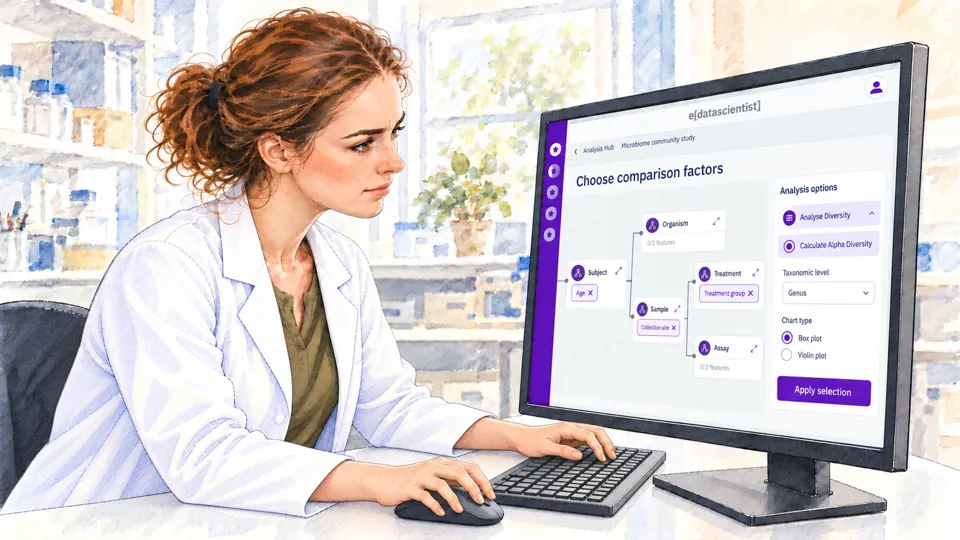
- Choose alpha diversity
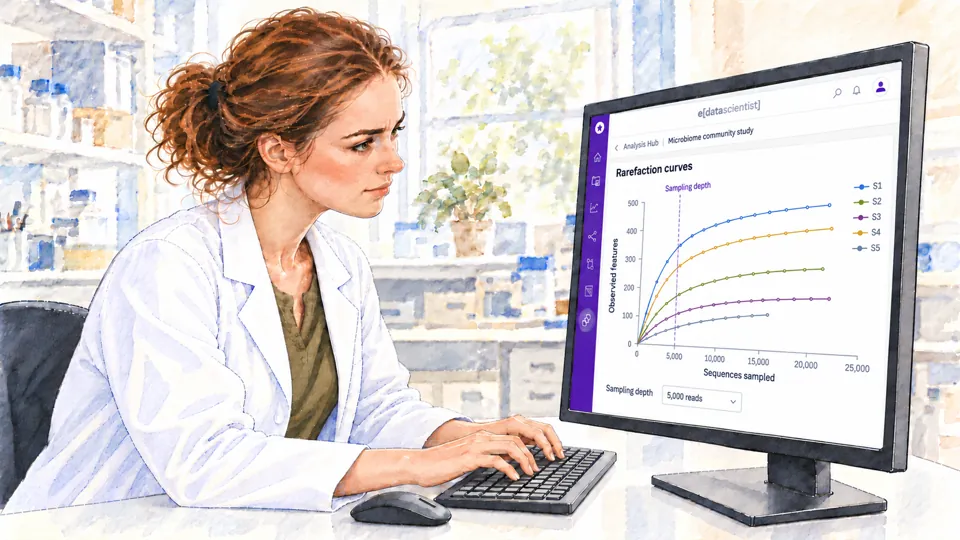
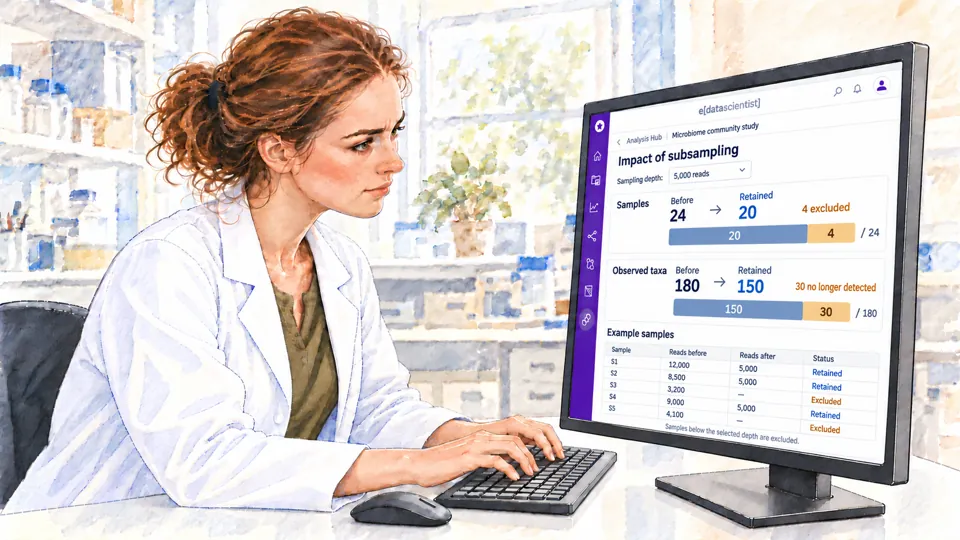
- Explore rarefaction curves
- Review scaling impact
- Analyse within-sample diversity
- Choose comparison factors
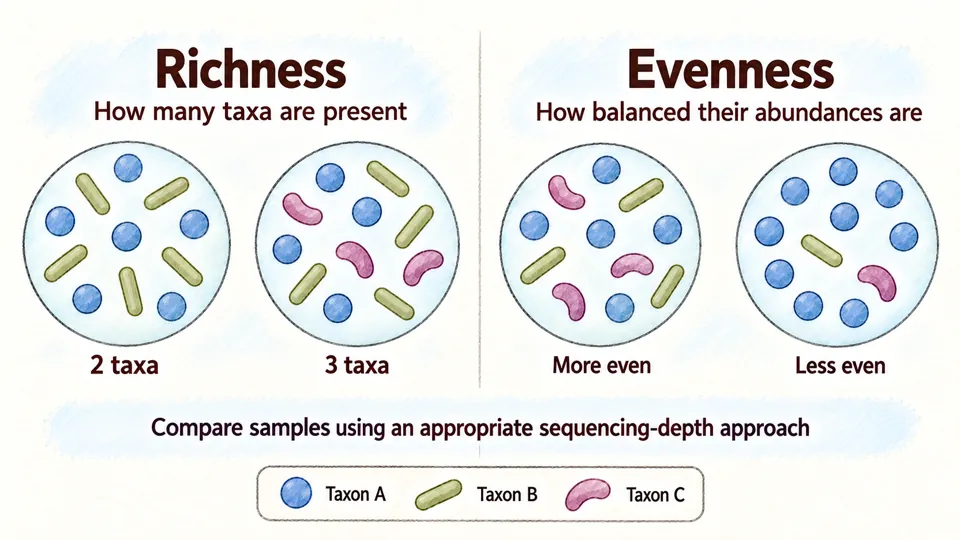
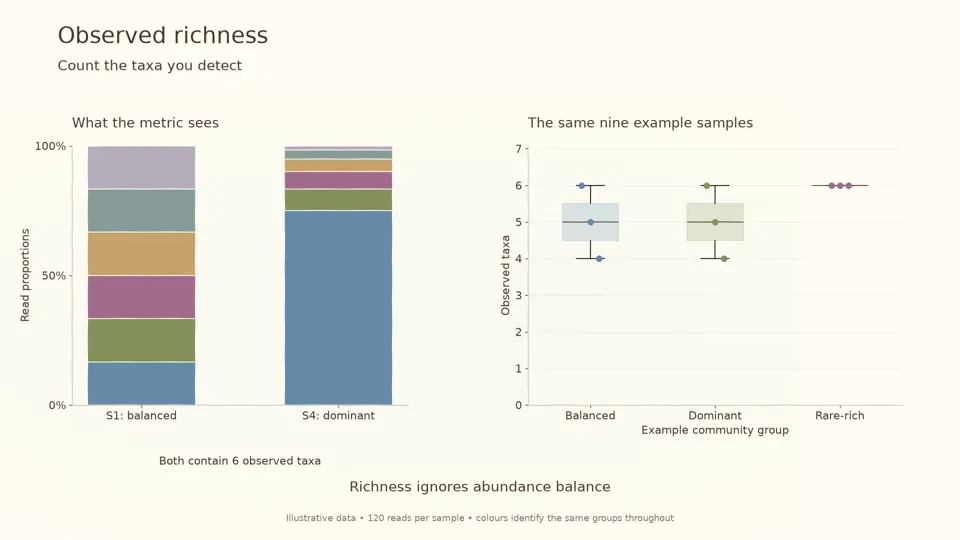
- Count observed species
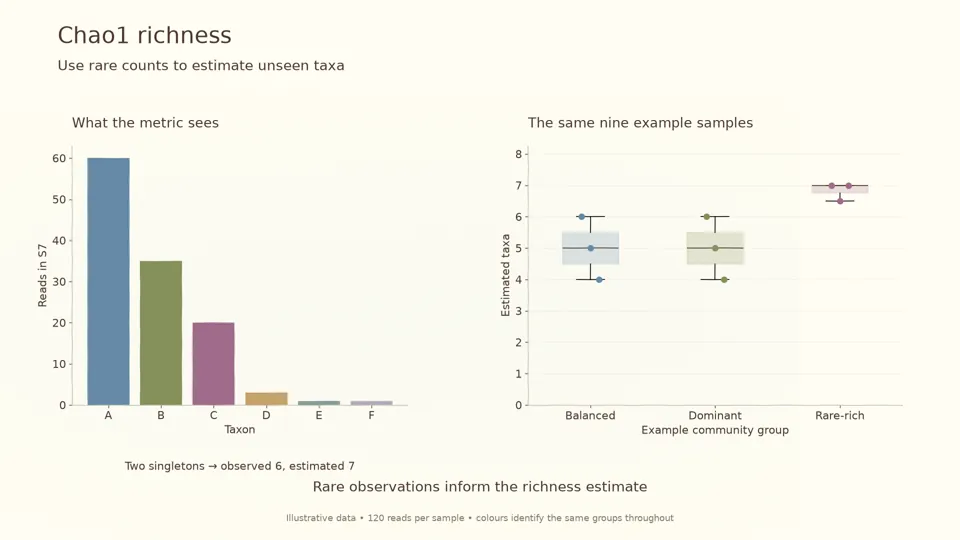
- Estimate species richness
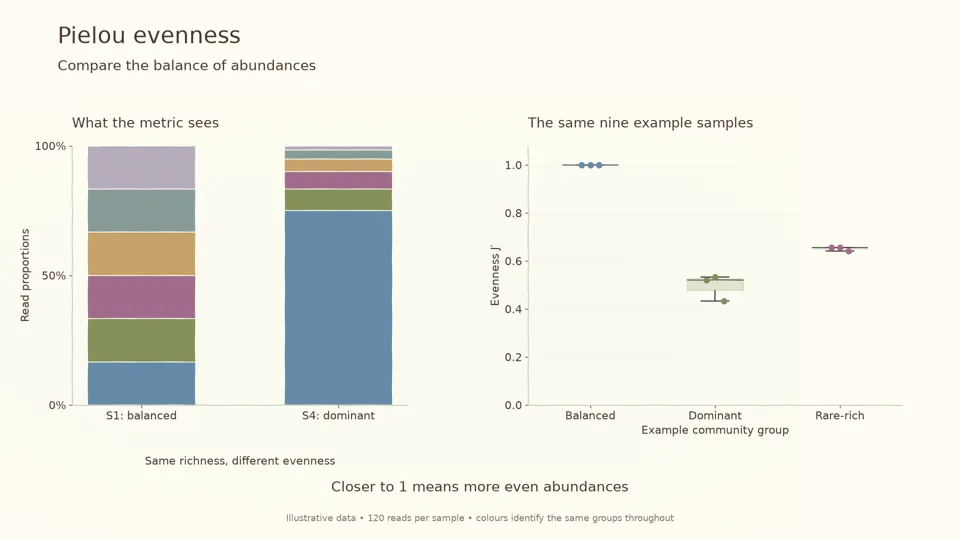
- Measure species evenness
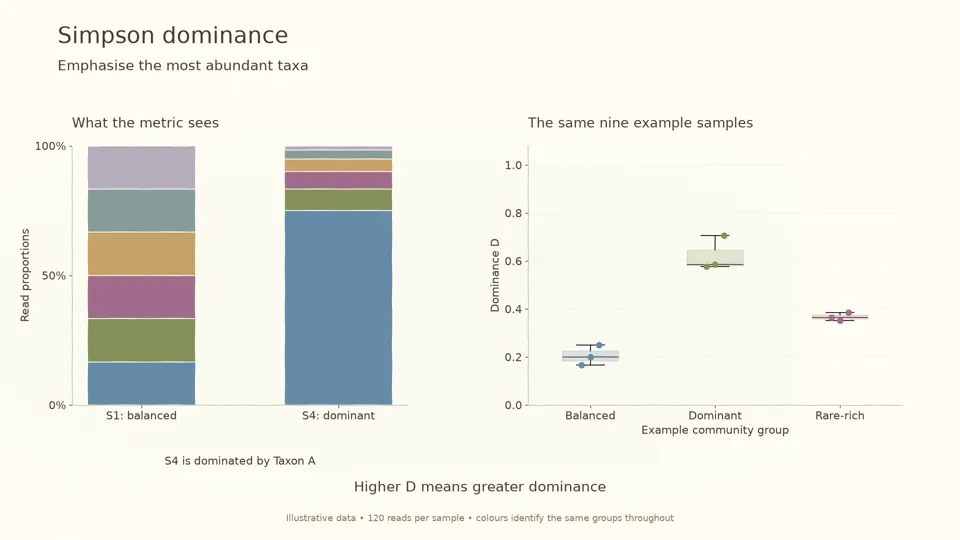
- Measure species dominance
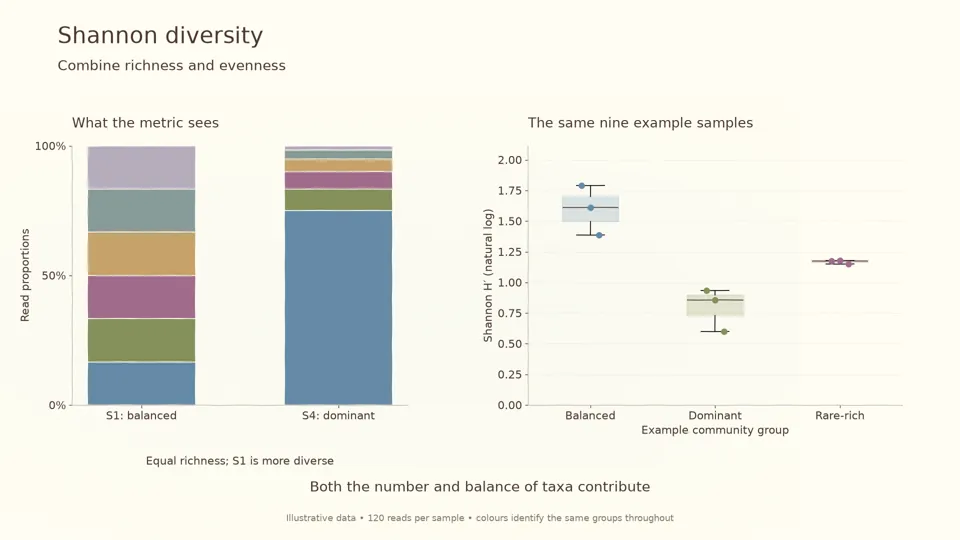
- Measure overall diversity
- Compare richness and abundance
- Measure evolutionary diversity
- Compare diversity indices
- Export results
- Prepare between-sample comparisons
- Select comparison data
- Set up beta-diversity analysis
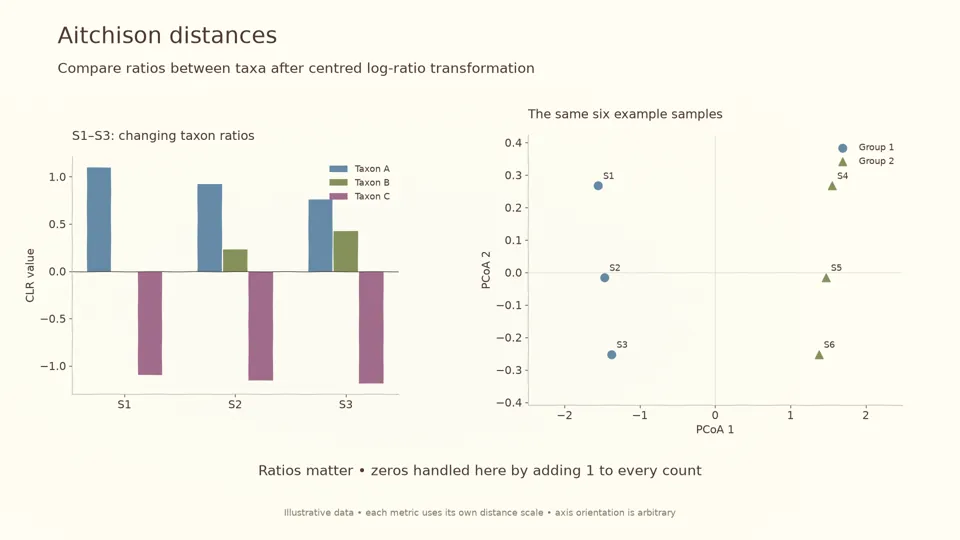
- Prepare compositional data
- Scale or binarise data
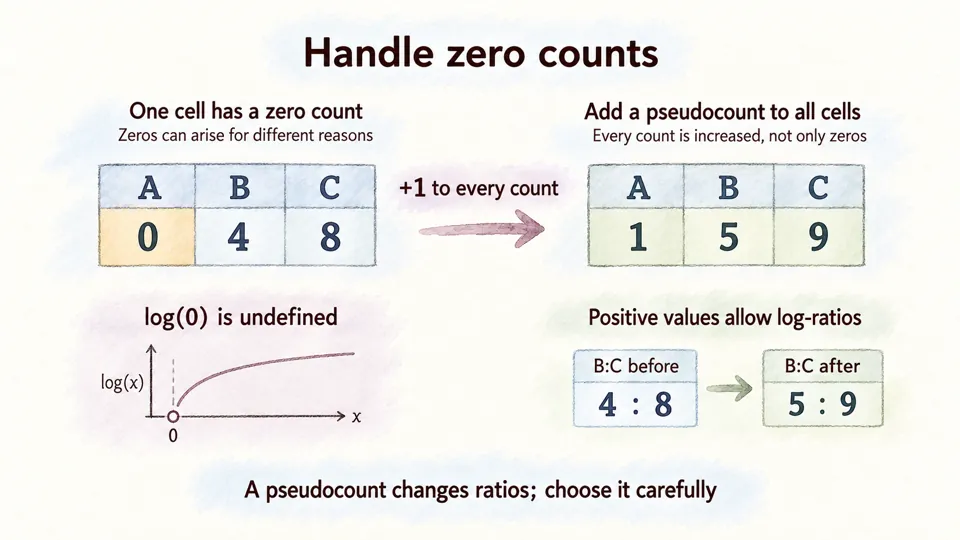
- Handle zero counts
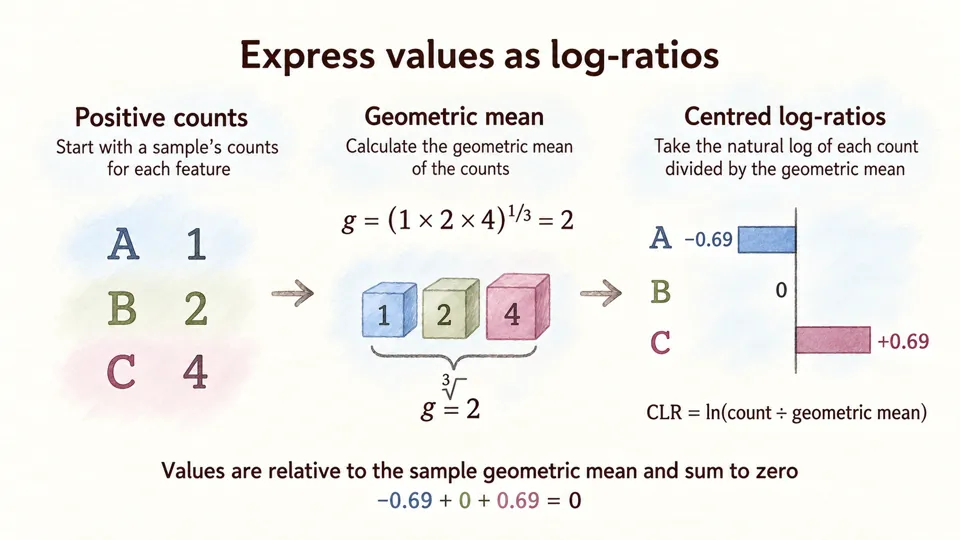
- Apply centred log-ratio transformation
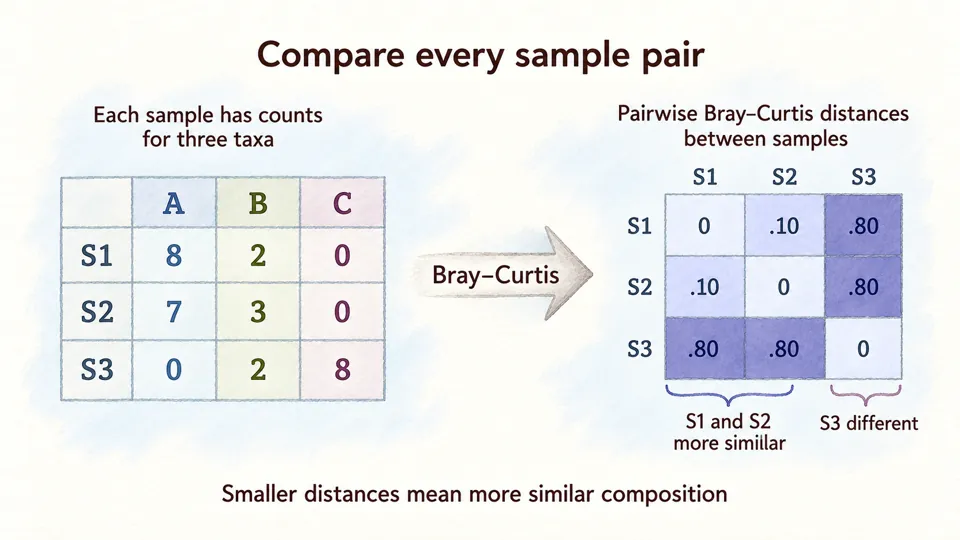
- Calculate pairwise sample distances
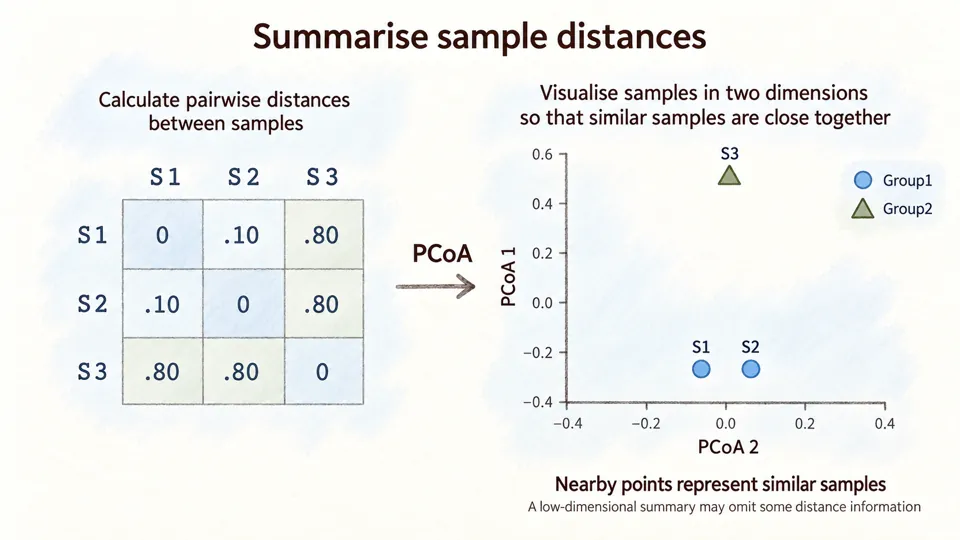
- Create an ordination plot
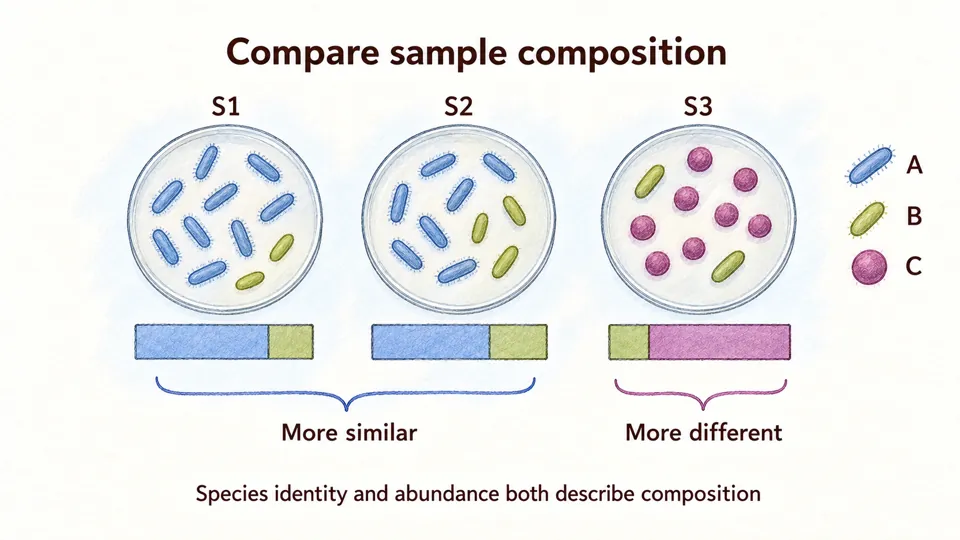
- Compare species composition
- Choose comparison factors
- Compare species composition
- View Aitchison distances
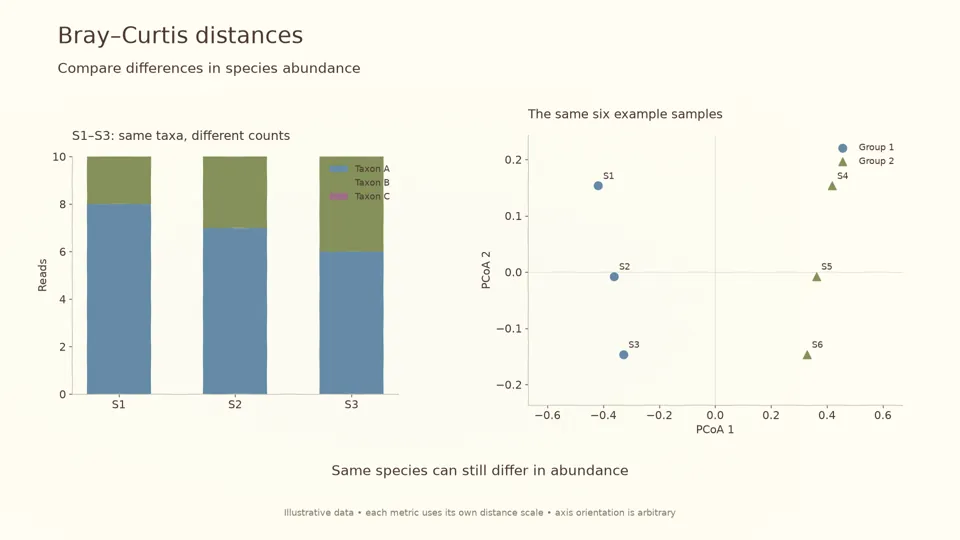
- View Bray–Curtis distances
- View Jaccard distances
- Explore differences by contextual factor
- Compare beta-diversity plots
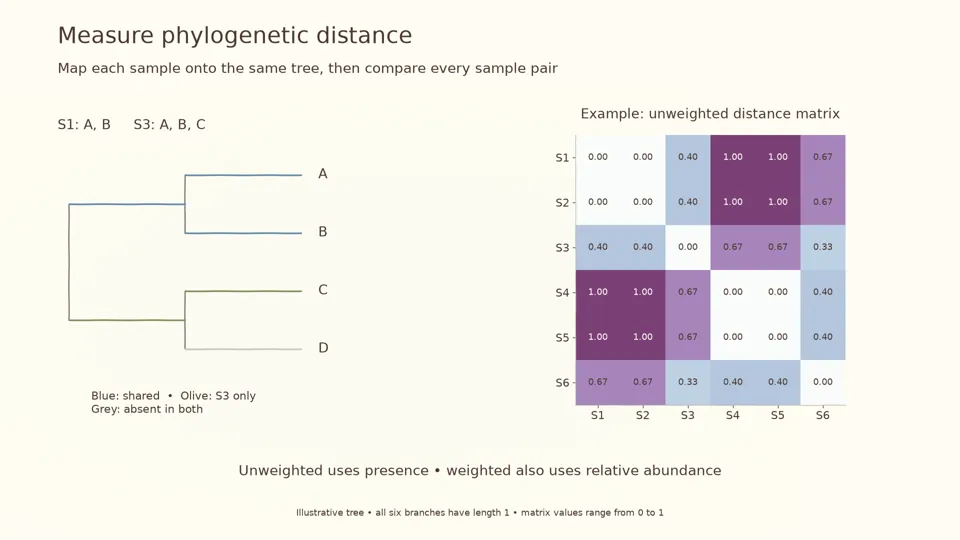
- Compare phylogenetic differences
- Build a phylogenetic tree
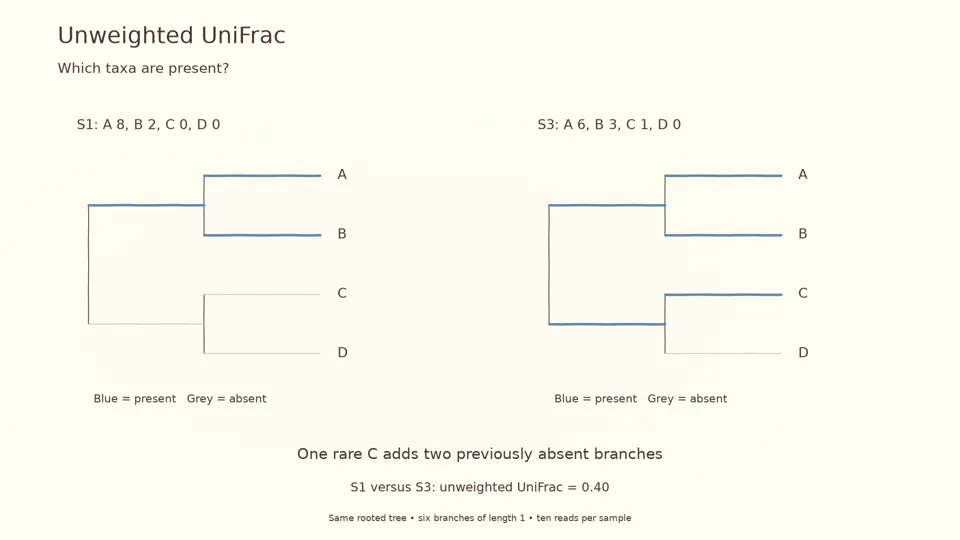
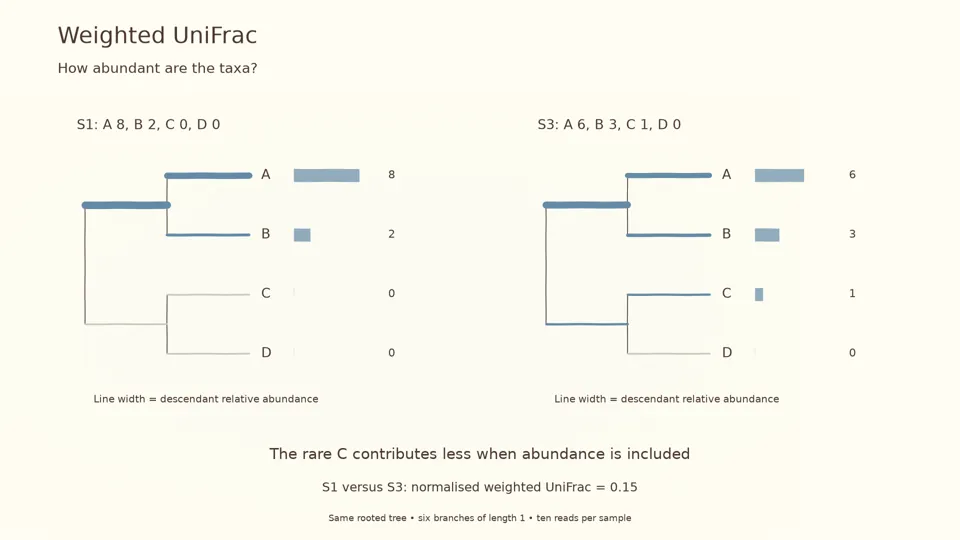
- Measure phylogenetic distance
- Calculate unweighted UniFrac distance
- Calculate weighted UniFrac distance
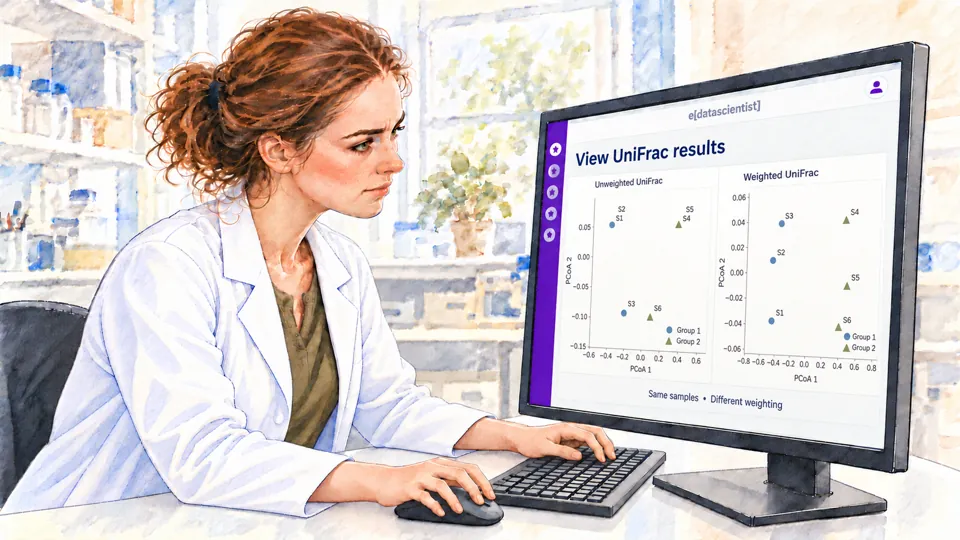
- View UniFrac results
- Compare distance matrices
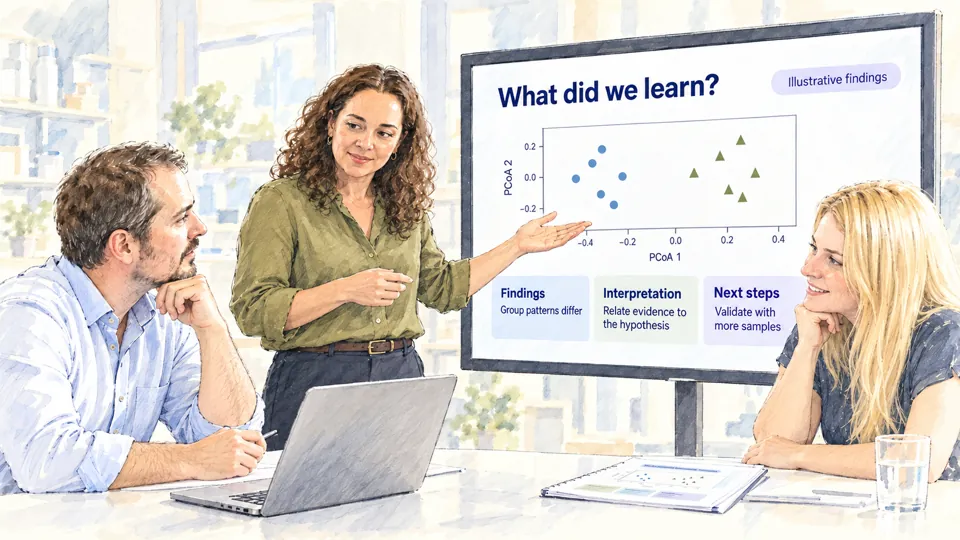
- Present findings to the team
My approach
I wanted to connect the platform around the journey from a scientific question to a defensible insight, embedding specialist knowledge where scientists needed to make decisions.
That meant making methods, assumptions and confidence visible throughout the analysis. It also meant defining how findings could become reusable organisational knowledge: retaining their evidence and provenance so later research could build on or challenge them.
I used concepts and working prototypes to make that direction tangible, while bringing customer value, scientific requirements and technical feasibility into decisions about what to pursue next.
What I changed
Embedded scientific expertise in guided analysis
I translated specialist knowledge into a guided Microbiome Statistical Analysis experience, helping microbiologists move from their data and experimental questions towards appropriate analyses and interpretable results.
Working with scientific specialists, I designed the journeys, validation, defaults and visible assumptions needed to support those decisions. The designs connected analytical choices to visual results and recommended hypothesis tests, while showing where expert scrutiny was still required.
This commitment, coupled with her attention to detail, and deep understanding of IT architecture, consistently ensured exceptional product designs that fully met scientific needs.
Turned the hypergraph ambition into a tangible product direction
I defined how scientists could explore connected evidence for different research and product-development goals, then created the initial concepts.
The direction showed how findings from separate studies could become evidence-bearing relationships, retaining their provenance and statistical confidence as knowledge evolved.
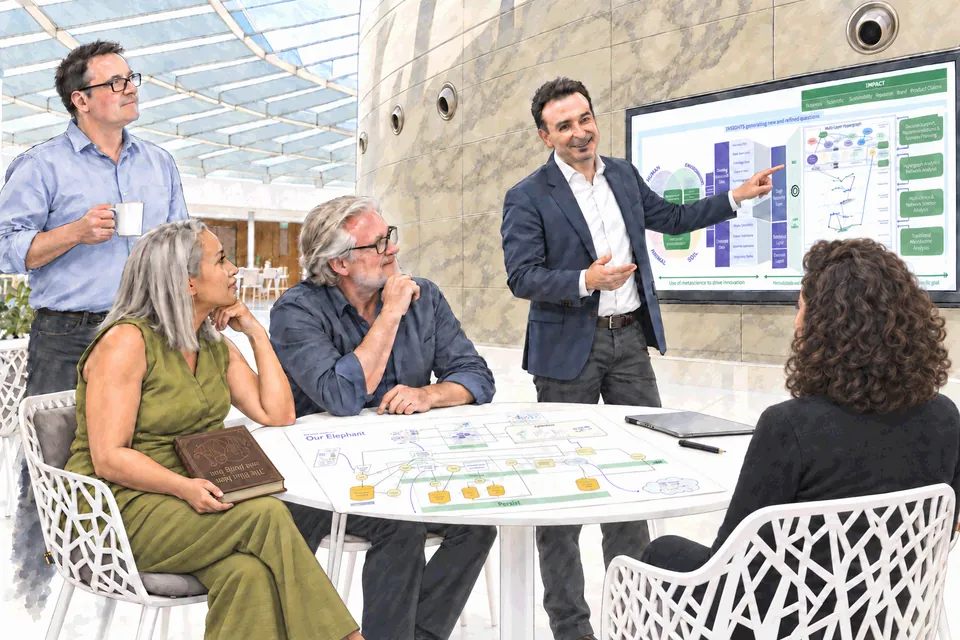
Designers under my leadership developed the high-fidelity designs, which the prototyping team turned into a functioning front end for exploring networks containing thousands of microbes. This gave stakeholders a concrete experience to evaluate and exposed the scientific value, evidence requirements and performance that still needed validation.
Aligned the roadmap with customer value and delivery feasibility
I made the choices between the longer-term vision and a deliverable next step explicit. Customer journeys and prototypes helped stakeholders assess the value of connected knowledge alongside dependencies in data preparation, performance and support.
The team prioritised a focused improvement to the existing Exploration experience, rather than committing to the complete hypergraph proposition before those dependencies were resolved.
The ability to influence all stakeholders, including c-suite with her design vision and execution is well evidenced.
Built design and prototyping capability
I moved design upstream into discovery and product definition, bringing scientific specialists and customers into the work before requirements were fixed.
I established shared design foundations and linked, version-controlled Figma flows, giving designers, product and engineers a common reference for the intended experience. I also brought data-science prototyping into the design team, connecting concept development with the scientific and technical expertise needed to explore it.
Outcomes
The work delivered a functioning network-exploration front end, giving stakeholders a concrete basis for evaluating the experience and identifying dependencies before committing further.
The guided statistical-analysis designs received positive customer feedback. Design became involved earlier in product decisions, with scientific expertise, customer research and prototyping contributing before requirements were fixed.
The delivered statistical-analysis MVP did not reliably realise the intended experience. Eagle entered administration before dependable adoption, scientific outcomes or commercial impact could be established.
Platform functionality · 2024 release plan
Data onboarding & management
Study data upload and validation
- Download study template
- Create new study
- Upload and validate study and sample metadata
- Upload and validate measurement data
- Support for third-party upload of measurement data
- Eagle Core Studies on platform
- Re-upload of metadata pre-onboarding
- Request new attributes or values
- Eagle Core Meta-Studies on platform
- Upload analysed data
Study management
- Preview study measurement files
- View list of onboarded studies
- Edit study name and description
- Preview study metadata
- Search and filter studies
- Study witnessing
- Role-based access control
- Search by contextual data
- Create virtual cohort study
- Study folder organisation (tabs)
- Study versioning
- Data versioning and provenance
- View study pipeline runs
Controlled vocabulary and ontology management
- Controlled vocabulary
- Integrated CV and Ontology Management System validation
- Controlled vocabulary lookup in Ontology Management System
- AI-based data curation
Signature upload
- Download signature template
- Create new signature set
- Upload signature metadata
- Validate signature contextual data
- Upload signature files
Signature management
- View list of onboarded signatures
- Search and filter signatures
- Tabular preview of signature
- Save signature as analysed measurements to study
Classification & foundational analysis
Data processing
Upload data and run a new pipeline(descoped)- View my pipeline runs
- Download pipeline output
- Run new pipeline from onboarded study
- Auto-save pipeline outputs to study
- Search and filter pipeline runs
- View study pipeline runs
- Guided pipeline selection
Statistical analysis
- Create new analysis
- Select samples and measurement data
- Visualise data
- Hypothesis testing
- Feature abundance
- Alpha diversity
- Beta diversity
- Differential abundance (microbiome)
- Differential expression (transcriptomic)
- Differential abundance (proteomic)
- Enhanced differential abundance visualisations
- Explore and stratify samples
- View pipeline output visualisations
Signature analysis
- Visualise signatures
- Signature comparison
- Create gene sets
Network analysis
Infer biological networks
- Reconstruct biological networks
- Network clustering analysis
- Network differential analysis
- Network similarity analysis
- Differential abundance (microbiome)
- Discriminant analysis
- Host–microbiome analysis (microbiome and transcriptomic)
Enhanced analysis
- On-demand hypergraph analysis
- Network comparisons
- On-demand virtual cohorts
- On-demand network analysis
- On-demand cluster analysis
- On-demand enrichment
- Therapeutic evaluation of strains
Visualisations & insights
AI
- AI Advisor
- Hypothesis generation
- AI Advisor
- Guided insights
Knowledge enrichment
- Selected database enrichment (MASI and disease)
- PubMed and RWD entity enrichment for multi-omics
- Text-mining PubMed for enrichment
- Analysis and scoring of text-mining results
- On-demand knowledge graph enrichment
- Query knowledge graph
- Knowledge confidence and provenance scoring
- Adding user weightings and validations
- Saving inferred insights
Network viewer
- List of networked measurement data
- Single network viewer
- Switch visualisation types
- Advanced search and filtering of node network properties
- Advanced view of node, edge, cluster and network properties
- Viewer with multiple network view switcher
- Graph navigation
- Nearest neighbour (×3)
- View entity literature references
- View literature references (network construction)
Enhanced exploration (stand-alone card viewer)(descoped)
Exploration
- Create evidence board
- Hypergraph visualisations
- 3D graph navigation
- Note taking and annotation
- Visualisation insights
- Saving evidence
- Decision-making support
- Evidence collation
- Report generation
- Hypothesis scoring
- Hypothesis refinement
- Card-view visualisations
Applied skills
Product strategy and future-state vision, design-team and prototyping leadership, systems and service design, scientific workflow and decision-support design, product discovery and cross-functional facilitation, complex data visualisation
Team
Designers, product managers, microbiologists, bioinformaticians, data and network scientists, architects and engineers, C-suite executives and external design agency