Office for National Statistics—2020 to 2022
Making Census data work for everyone
ONS expanded Census dissemination beyond predefined outputs into a joined-up public service, giving many more people localised, interactive and configurable access to trusted data.
01
From fixed outputs to questions people could ask
For the 2011 Census, ONS released more than 700 predefined tables. ONS chose the available combinations of variables and geography; anything different required a commissioned, disclosure-checked table that could incur a charge.
The ambition for 2021 went beyond replacing spreadsheets with a modern website. ONS wanted people to explore the evidence and safely form their own questions, without compromising accuracy, impartiality or confidentiality.
I joined a newly formed service-design team and, working with another senior service designer, co-led a six-week discovery that crystallised the challenge:
How could ONS democratise access to one protected evidence base, so that many more people, not only statistical specialists, could understand and use it for public good?
02
Designing many routes into the same evidence
No single journey could serve everyone. Analysts needed granular data and methodology; technical users needed machine-readable access; policymakers and journalists needed evidence they could interpret and reuse; citizens wanted to understand their own neighbourhoods.
Nor did needs divide neatly by occupation. Statistical literacy, digital confidence, accessibility, language, time and trust all shaped how someone could engage with the evidence.
Many people would encounter Census findings through search, local authorities, community groups and the media rather than the ONS website. These routes were part of the service, not simply ways to promote it.
ONS therefore needed to offer different depths of access to the same evidence while keeping every route accurate, trustworthy and safe, particularly for small populations and sensitive subjects.
03
Turning separate product ideas into one service
Publishing had already developed behavioural personas, but they existed largely as pen portraits and were rarely understood or used elsewhere in ONS. I studied what they represented, then translated and visualised their behaviours and needs so teams could use them to make product and release decisions.
We began with visioning workshops that brought together interdependent departments whose teams had not necessarily worked together before. The sessions aligned them around shared goals for Census outputs and established relationships essential to delivery.
Over six months, I co-led around thirty topic workshops, bringing statistical, product, publishing, content, communications, research and technical specialists into the same decisions.
This changed the starting question:
From
What did we publish in 2011?
To
What are people trying to understand or decide?
This helped teams determine what the data could responsibly answer, what required a later release and what the Census could not support.
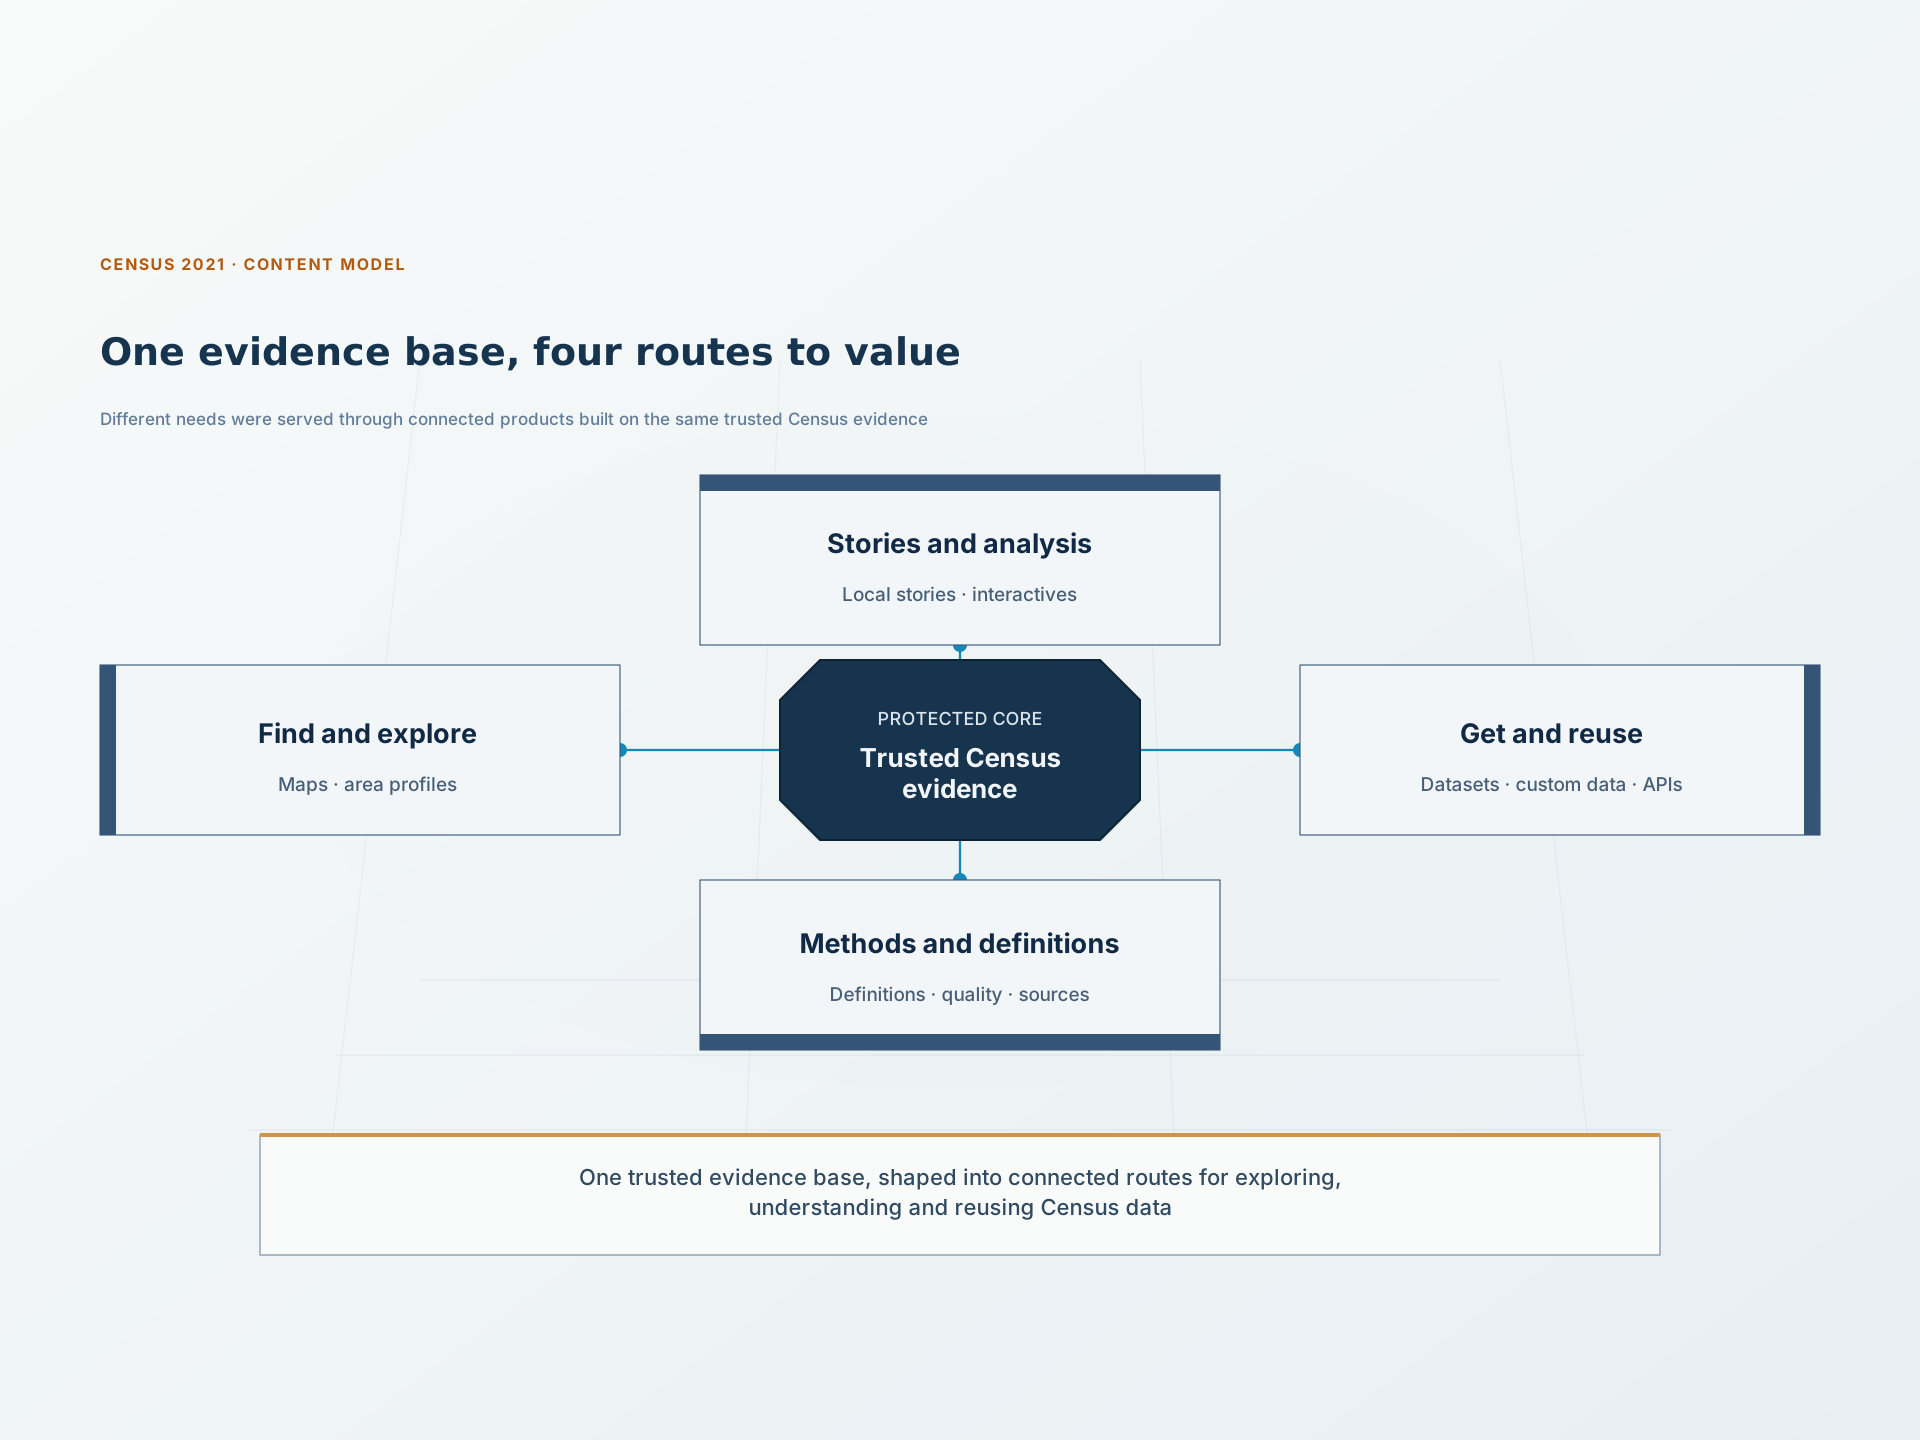
Teams already had ideas for products. What was missing was a coherent portfolio showing how they worked together. We connected stories and maps, area profiles, analysis, datasets and APIs into different routes through the same trusted evidence.
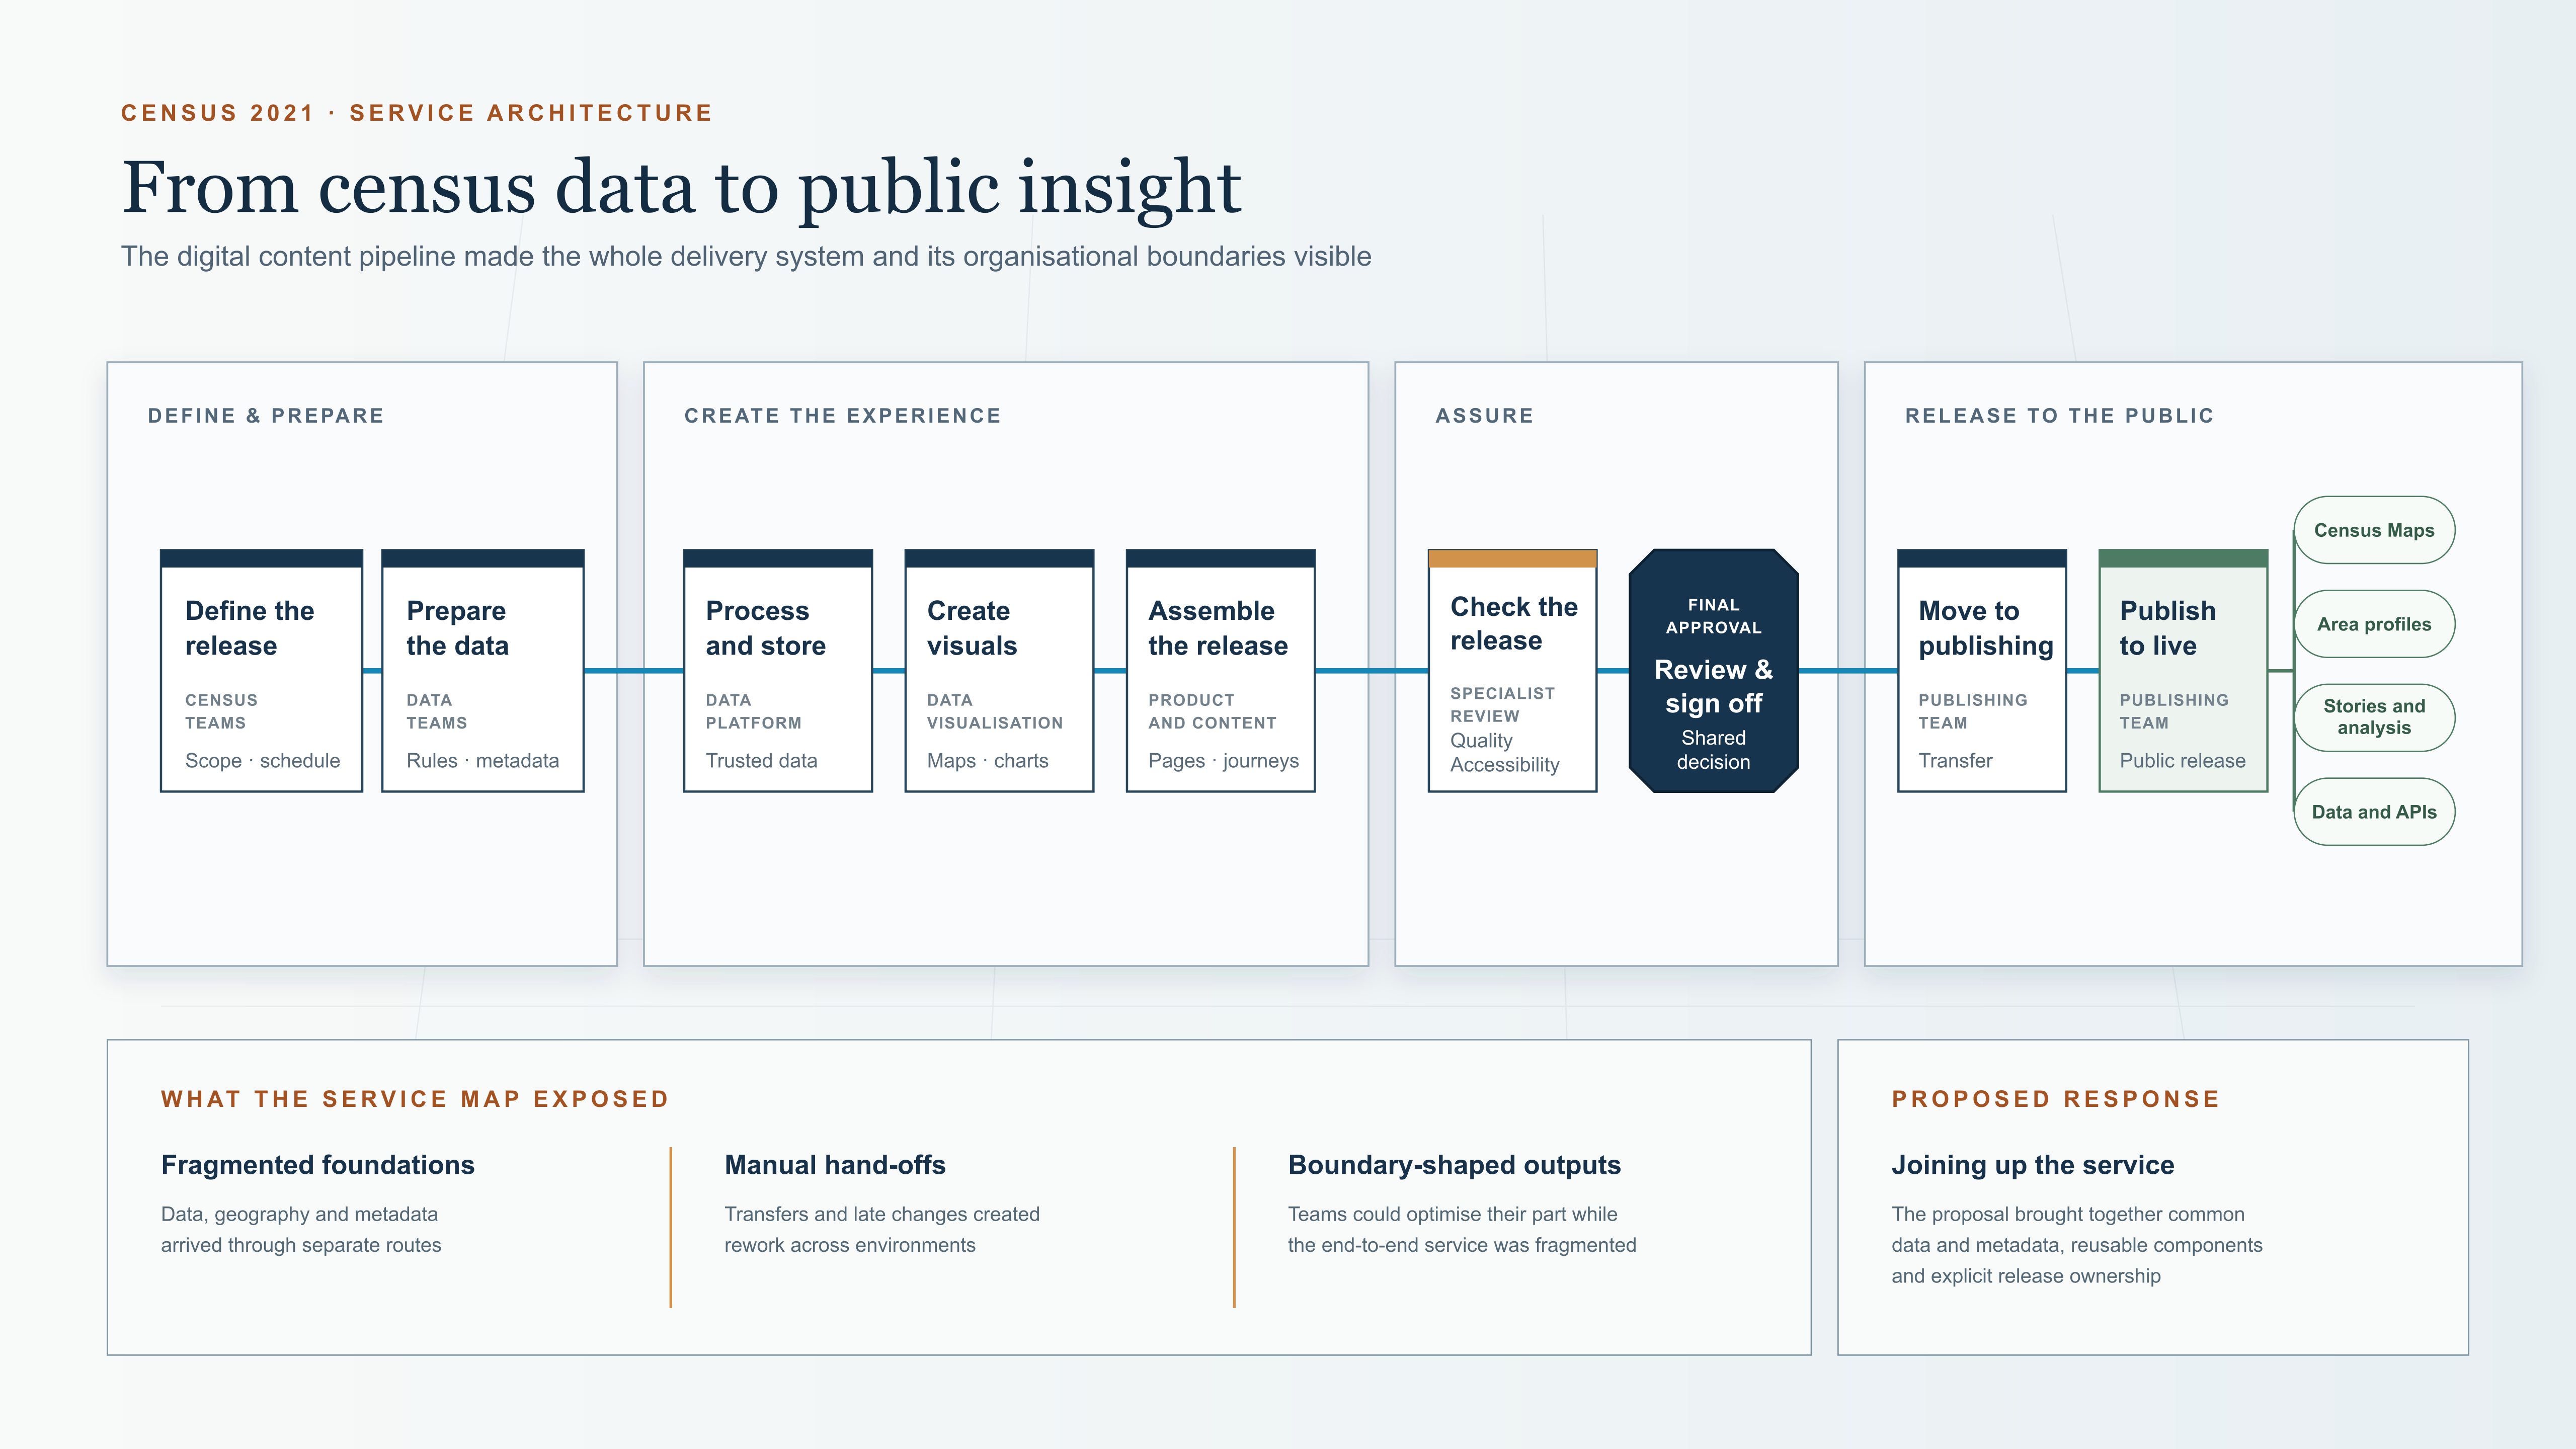
Making that portfolio work required service and systems design behind the products. Mapping dependencies across data, geography, disclosure control, technology, accessibility, assurance and ownership exposed fragile hand-offs and gaps that an interface alone could not solve.
Caption
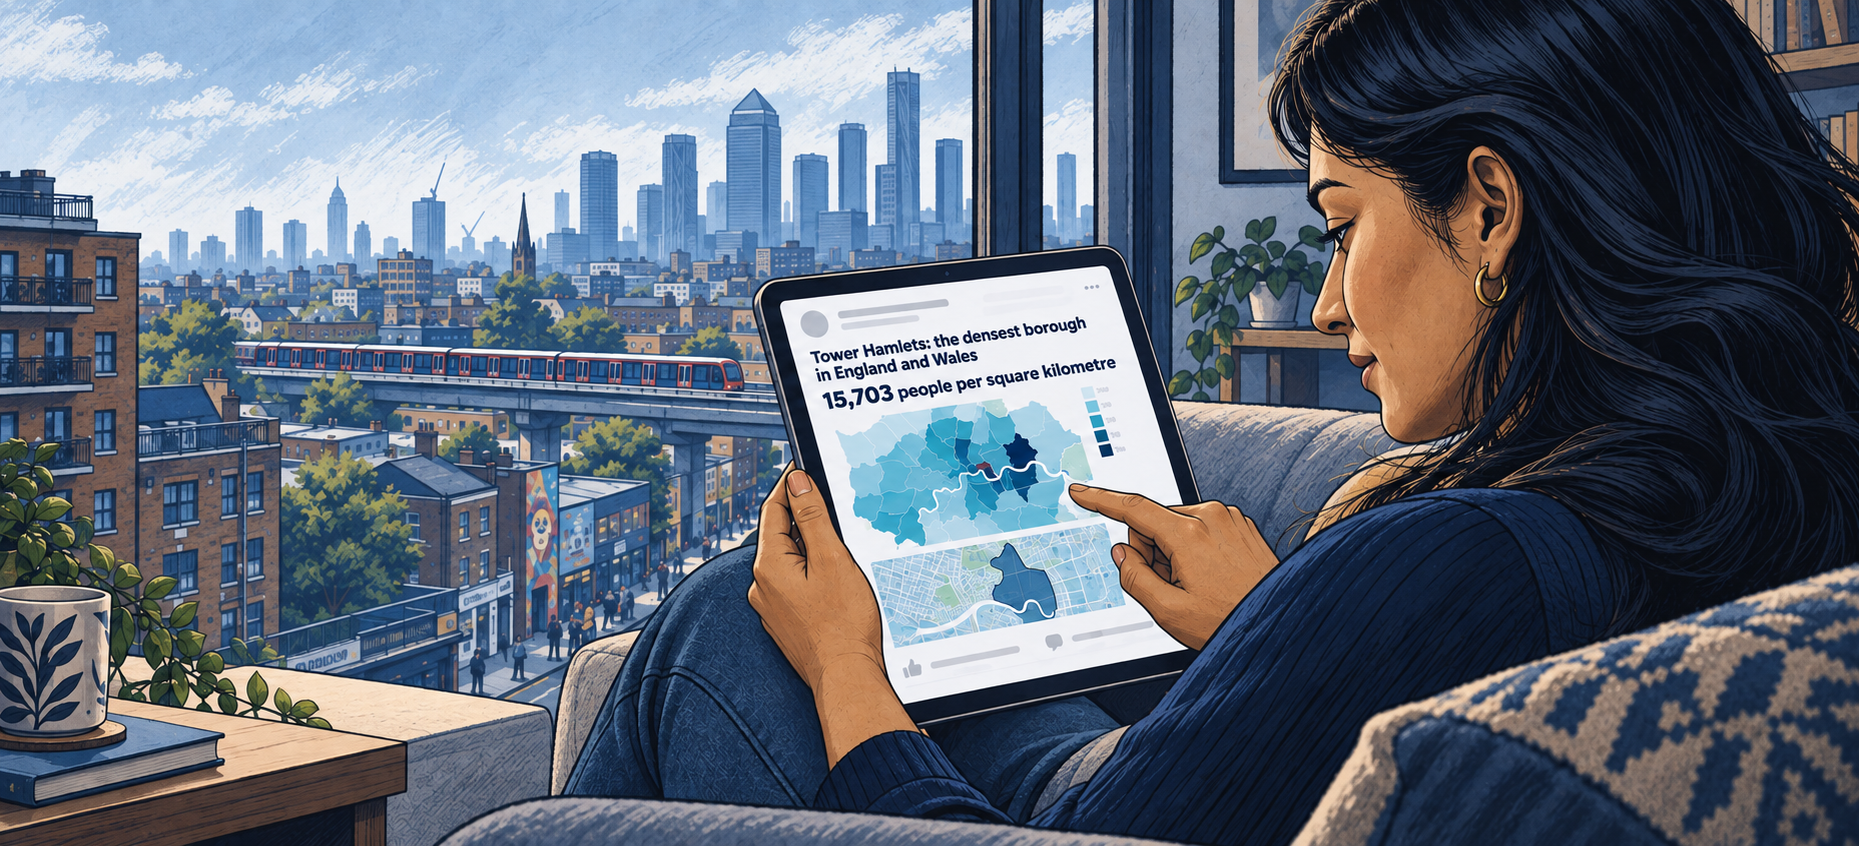
Census Maps and local stories took the same evidence to audiences who might never open a statistical dataset.
04
Making the shared vision deliverable
Alignment changed release planning from a sequence of departmental hand-offs into a shared design process. Bringing disciplines together early allowed teams to shape releases around user needs and address dependencies before they became delivery risks.
We refined the approach as we learned, using smaller groups for detailed decisions and clearer ownership to turn broad participation into progress.
We also defined success from two perspectives: whether people could use the evidence and whether ONS could publish it securely, accessibly and on time. This turned the shared ambition into practical criteria for decisions across the portfolio.
05
Reaching people at national scale
I left ONS in January 2022, before the first Census 2021 results were published. The wider programme subsequently delivered a portfolio that closely reflected the service model and release planning developed upstream.
Create a Custom Dataset represented the fundamental shift. Users could select variables, populations and geography rather than rely on combinations chosen in advance, with automated disclosure checks protecting people’s identities.
Census Maps recorded around 30 million interactions following its November 2022 launch. ONS also produced 331 semi-automated local stories, reused by dozens of local news titles and generating more than eight million Google search impressions.
These were collective programme outcomes. The Office for Statistics Regulation found that users valued Census Maps and Create a Custom Dataset, and that the range of outputs helped people maximise the value of Census data. It also found that the volume of material could still be difficult to navigate.
The result was not simply more Census products, but a service that allowed far more people to approach the same national evidence in a form suited to their needs.